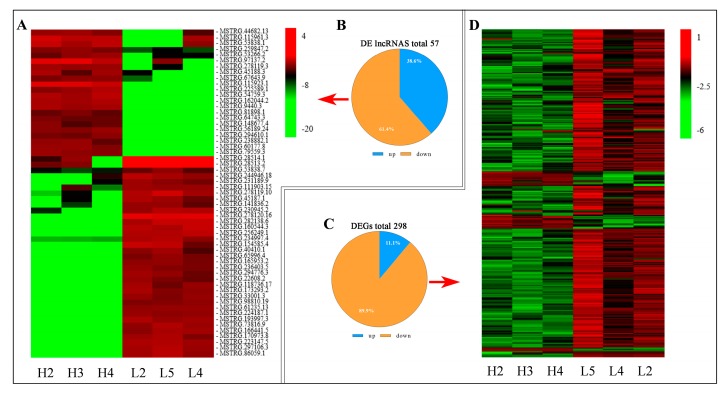
Figure 3.
The number of differentially expressed (DE) lncRNAs and DE genes (DEGs) in H and L groups comparisons. (A) The hierarchical cluster of DE lncRNAs. (B) Total number of up-regulated and down-regulated DE lncRNAs in each comparison. (C) Total number of up-regulated and down-regulated DEGs in each comparison. (D) The hierarchical cluster of DEGs.

