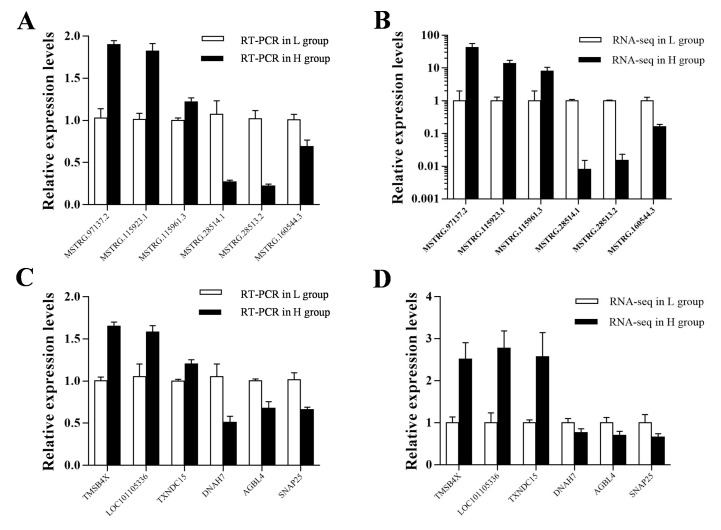
Figure 4.
The verification of expression level of DE lncRNAs and DE mRNAs in different groups. (A, B) The relative expression level of 6 DE mRNAs in different groups determined by qRT-PCR and RNA-Seq, respectively. TMSB4X, thymosin β 4 X-linked; TXNDC15, thioredoxin domain containing 15; DNAH7, dynein axonemal heavy chain 7; AGBL4, ATP/GTP binding protein like 4; SNAP25, synaptosome associated protein 25. (C, D) The relative expression level of 6 DE lncRNAs in 2 groups determined by qRT-PCR and RNA-Seq, respectively. The relative expression level of DE lncRNAs and DE mRNAs in the pituitary was determined by qRT-PCR and normalized to the expression amount of HPRT1. The qRT-PCR data were represented as the mean ± SEM of three biological and technical replicates. The RNA-Seq data represented the FPKMs of each transcript.

