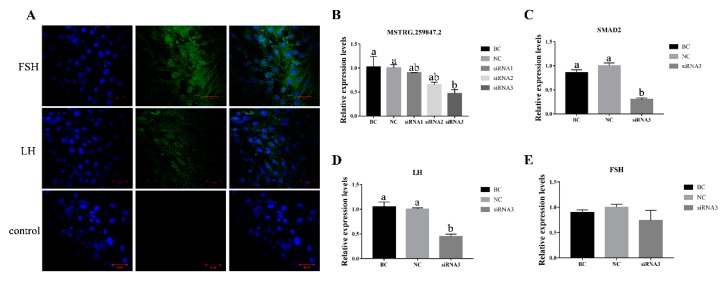
Figure 8.
(A) Identification of sheep pituitary cells by FSH and LH immunofluorescence staining. The left panels DAPI staining for nucleus, middle panels show antigen-specific staining and the right panels show their merged images. Bars indicate 50μm. (B) The relative expression levels of lncRNA MSTRG.259847.2 in sheep pituitary cell transfecting with MSTRG.259847.2 siRNA 1, 2 and 3. (C) The relative expression of SMAD2(lncRNA MSTRG.259847.2 target gene) in sheep pituitary cell transfecting with MSTRG.259847.2 siRNA3. BC and NC represent blank and negative controls, respectively. Results are expressed relative to the BC group as mean values ± the SEM. a, b: different letters denote statistically significant differences within each group. (D, E) The relative expression of LH and FSH in transfected pituitary cells was determined using qPCR. The relative expression levels were normalized to the expression levels of GAPDH. Results are expressed relative to the blank control mean values ± SEM. a, b, c: different letters denote statistically significant differences within each group; p < 0.05.

