Figure 6.
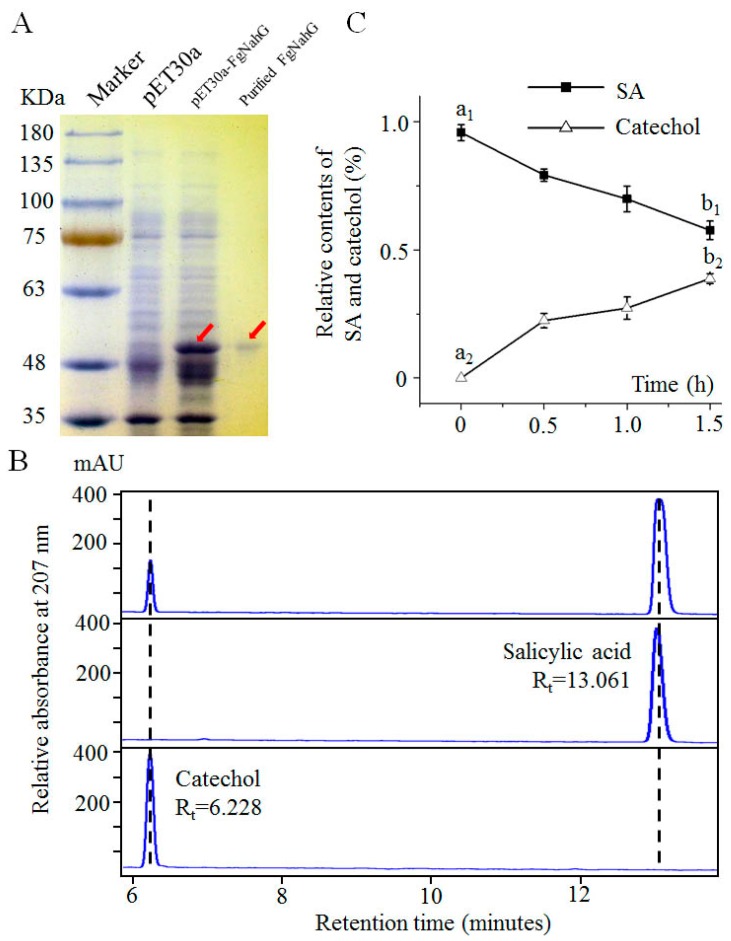
Expression of FgNahG in E. coli and the activity of the encoded enzyme. (A) SDS-PAGE analysis of the FgNahG protein. pET-30a, proteins from E. coli cells carrying the pET-30a vector; pET-30a-FgNahG, proteins from E. coli cells carrying the recombinant pET-30a-FgNahG vector; purified FgNahG, FgNahG protein purified from pET-30a-FgNahG cells. Red arrows indicate the FgNahG protein. (B) HPLC analysis. The lower and middle panels present the peaks for catechol and salicylic acid (SA), respectively. The upper panel reveals the presence of SA and catechol when SA was mixed with recombinant FgNahG protein. Rt, retention time. (C) Measurement of the relative SA and catechol contents in the reaction mixture. The SA and catechol concentrations were determined by HPLC at 0, 0.5, 1.0 and 1.5 h after the addition of SA. Analyses at each time point were completed with three biological replicates per treatment. The SA and catechol contents at 0 and 1.5 h were compared. Different letters indicate significant differences at p ≤ 0.01.

