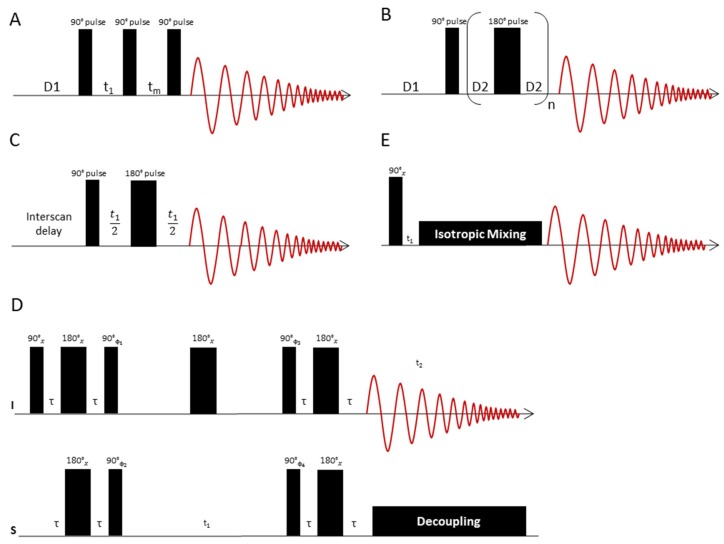
Figure 4.
(A) The 1D NOESY pulse sequence consists of a presaturation interval (D1), an excitation pulse, which after a short time t1 (phase switching time) is followed by another 90° pulse. After another time tm, the spin system is excited with another 90° pulse. During the time tm, the water saturation is switched on again to ensure complete water suppression. D1 denotes the relaxation delay time. (B) Representation of the CPMG pulse sequence: After a presaturation interval (D1), the spin system is excited with a 90° pulse. This is followed by a train of n 180° pulses, each pulse bracketed by two delay times D2, in which the spins refocus. Subsequently, the signal is recorded as an FID. The total delay time n*τ after n spin echo periods τ = (D2-180°-D2) is chosen so as to suppress the signals of fast relaxing molecules like lipids. (C) JRES pulse sequence to separate 1H chemical shifts and 1H,1H couplings into separate dimensions of a 2D display. The chemical shifts are displayed in the horizontal dimension, while the multiplet patterns show up in the vertical dimension. If strong coupling artefacts can be neglected, the horizontal dimension corresponds to a “broadband” decoupled proton spectrum. (D) HSQC pulse sequence to correlate proton and carbon chemical shift information. The sequence starts with an INEPT block, which transfers proton magnetization to 13C. The carbon magnetization is then labelled with 13C chemical shift information via a spin echo sequence, the duration of which is incremented in subsequent experiments. A reverse INEPT transfer brings back 13C magnetization to the proton channel, where it is recorded under 13C broadband decoupling. (E) TOCSY pulse sequence to correlate 1H chemical shifts that are part of a spin-spin coupling network. The sequence starts with proton magnetization, which is labelled with its precession frequency during t1. In a subsequent isotropic mixing step, a net magnetization transfer to coupled protons is performed. The extent of this magnetization transfer can be steered by adjustment of the length of the mixing delay. Values of 80 ms typically give spectra where magnetization has been transferred to all coupling partners of the excited spin, so that the whole spin system can be traced out. The signals of the coupling partners appear on horizontal lines in the spectrum, which eases analysis of metabolite spin systems.

