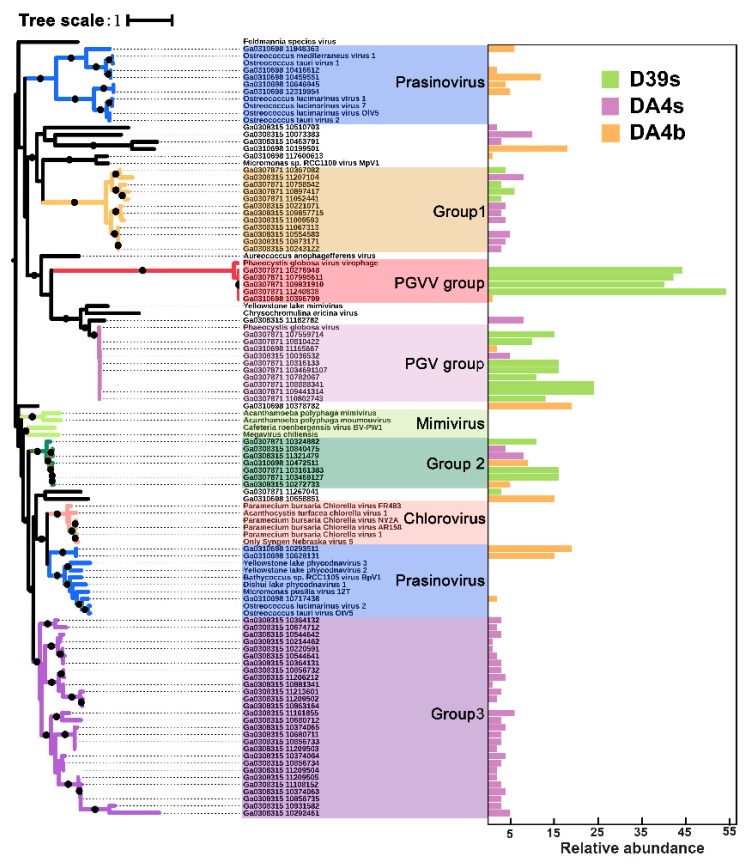
Figure 6.
Capsid_NCLDV phylogeny. A maximum-likelihood phylogenetic tree drawn from the capsid_NCLDV (PF04451) and six virophage putative major capsid (MCP) protein multiple alignment is shown (1000 iterations, JTT + G model). Bootstrap scores greater than 90% are marked with black dots. Each MCP is associated with an abundance profile (right) that displays the relative abundance of the contig across the three SSR viromes (based on normalized coverage).

