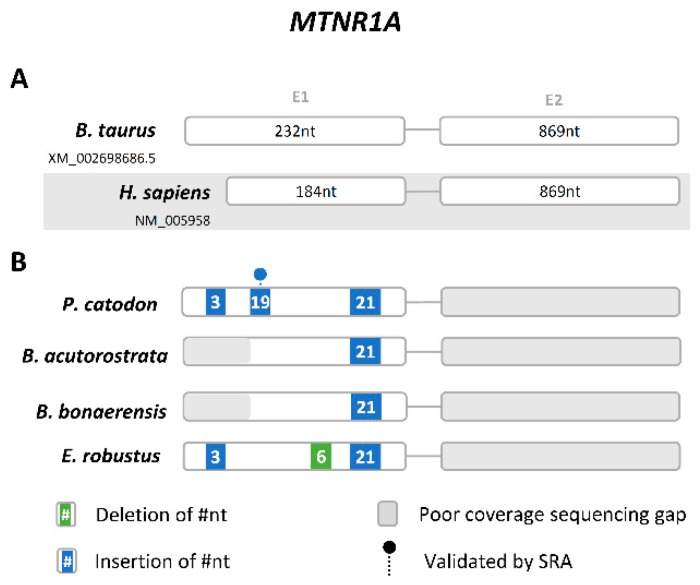
Figure 4.
Gene annotation of Mtnr1a relics in Mysticeti. (A) Schematic representation of the gene structure of human and B. taurus Mtnr1a gene (not to scale), each box represents an exon and lines represent intronic region. (B) Schematic representation of the corresponding Mtnr1a genes identified in Cetacea and location of the identified insertions and deletions.

