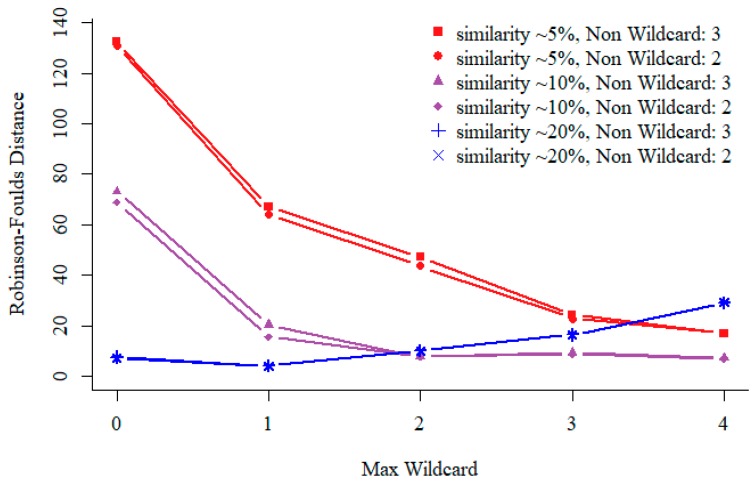
Figure 2.
Performance comparison with different non-wildcard and max-wildcard settings on sequences of different similarities. Test results on 200 simulated protein sequences of length 350 amino acid (aa). For different relatedness sequences, all support of the sequential pattern mining is 0.03. For a fixed non-wildcard, we generated patterns of max-wildcard between 0 and 4, i.e., with 2 non-wildcard and up to 4 max-wildcards. The vertical coordinate represents the distance of phylogenetic trees.

