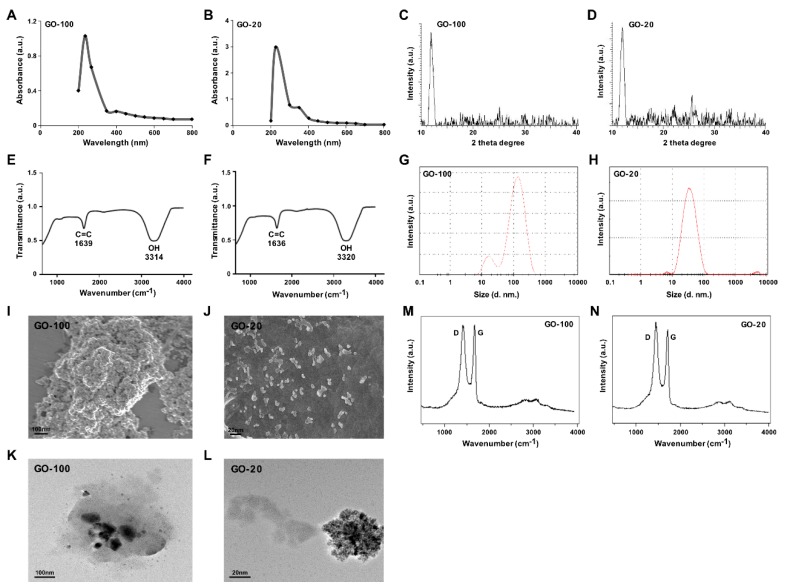
Figure 1.
Synthesis and characterization of ultra-small GO. Ultraviolet-visible spectroscopy of GO-100 (A) and GO-20 (B). XRD images of GO-100 (C) and GO-20 (D). FTIR images of GO-100 (E) and GO-20 (F). Dynamic light-scattering (DLS) spectra of GO-100 (G) and GO-20 (H). SEM images of GO-100 (I) and GO-20 (J). TEM images of GO-100 (K) and GO-20 (L). Raman spectroscopy images of GO (M) and GO-20 (N). At least three independent experiments were performed for each sample and reproducible results were obtained. The data represent the results of a representative experiment.

