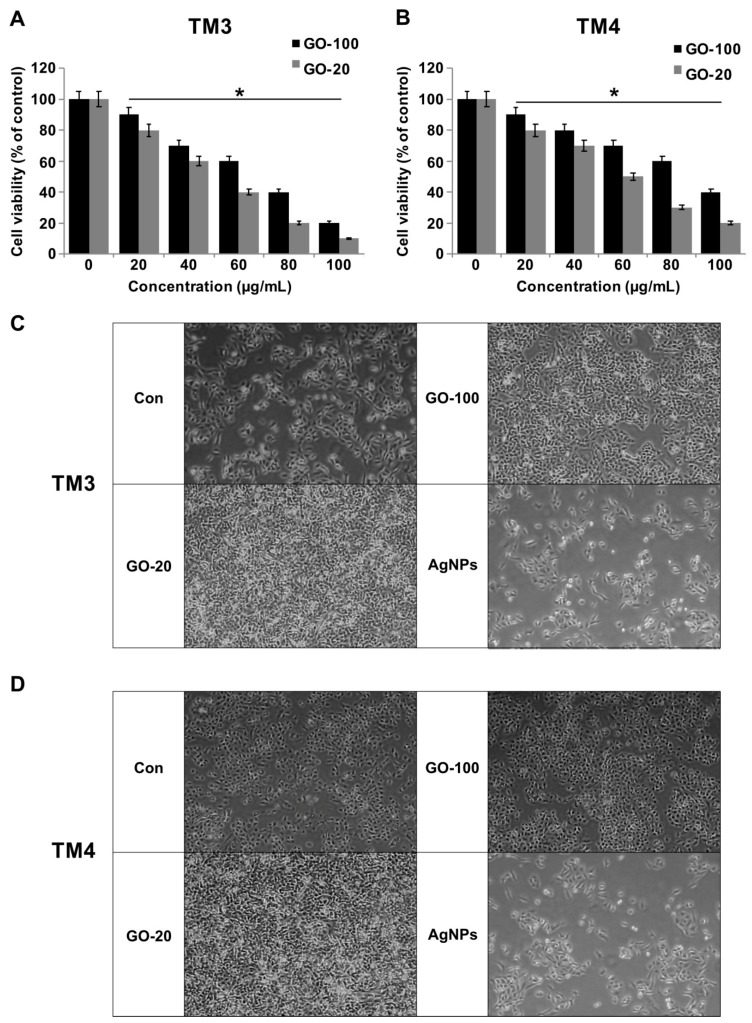
Figure 2.
GO-100 and GO-20 graphene sheets inhibit viability of TM3 and TM4 cells. (A) The viability of TM3 cells was determined after 24 h exposure to different concentrations of GO-100 (20–100 µg/mL) and GO-20 (20–100 µg/mL), and (B) the viability of TM4 cells was determined after 24 h exposure to different concentrations of GO-100 (20–100 µg/mL) and GO-20 (20–100 µg/mL) using the CCK-8 assay. (C) Cell morphology of TM3 was assessed under a light microscope. (D) Cell morphology of TM4 was assessed under a light microscope. The results are expressed as the mean ± standard deviation of three independent experiments. At least three independent experiments were performed for each sample. The treated groups showed statistically significant differences from the control group by Student’s t-test (* p < 0.05). Scale bar 200 µm

