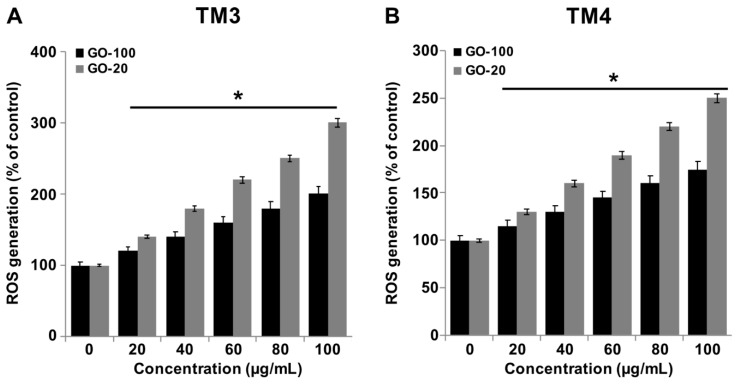
Figure 6.
GO-100 and GO-20 graphene sheets induce ROS generation. (A) TM3 cells were treated with GO (20–100 µg/mL) and GO-20 (20–100 µg/mL) for 24 h and ROS levels were measured using DCFH-DA. (B) TM3 cells were treated with GO (20–100 µg/mL) and GO-20 (20–100 µg/mL) for 24 h and ROS levels were measured using DCFH-DA. Relative fluorescence of 2′,7′-dichlorofluorescein was measured at an excitation wavelength of 485 nm and emission wavelength of 530 nm using a spectrofluorometer. The treated groups showed statistically significant differences from the control group by Student’s t-test (* p < 0.05).

