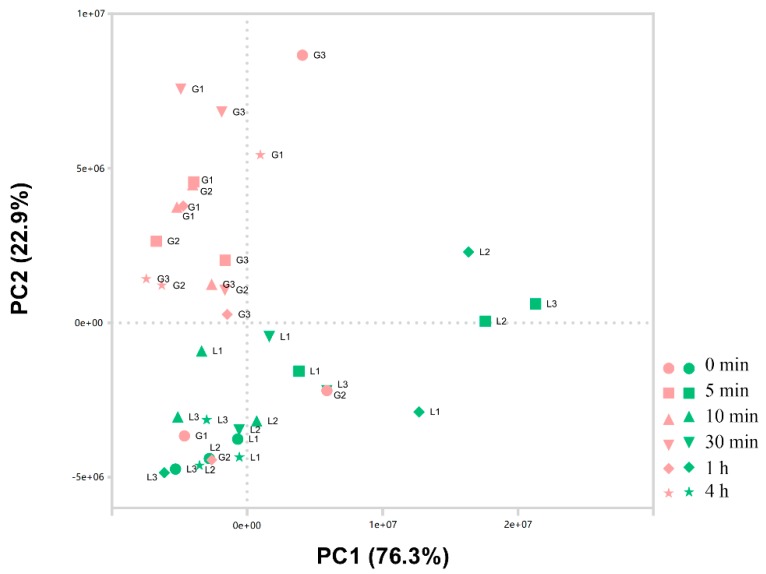
Figure 1.
Principal component analysis (PCA) plots of 36 samples from grain and flag leaf groups. G, grain; L, Flag Leaf; L1, 2, 3: Replicas 1, 2, 3. G1, 2, 3: Replicas 1, 2, 3. Triplicate samples from tissues of grain and flag leaf under heat stress (37 °C) for different treatment times (0 min, 5 min, 10 min, 30 min, 1 h, and 4 h) were analyzed.

