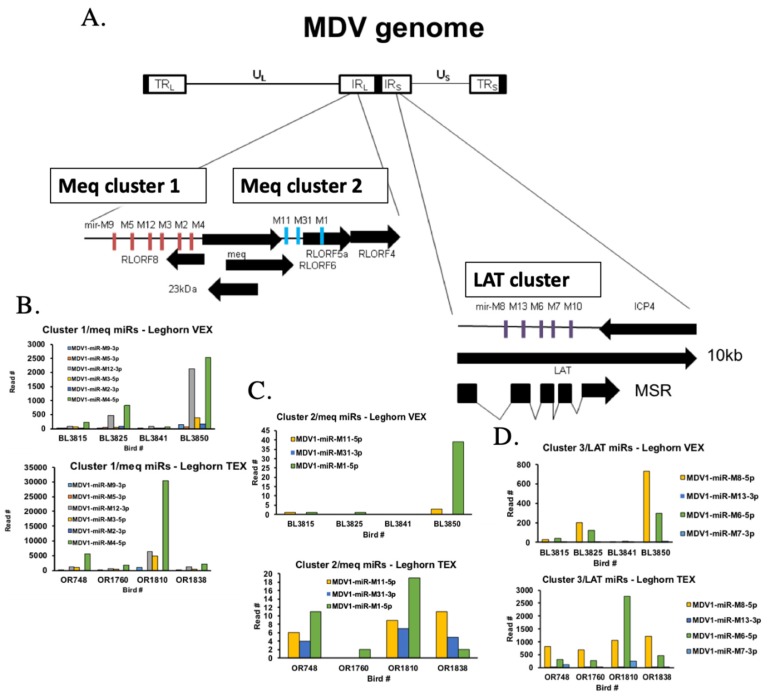
Figure 5.
Comparison of MDV-encoded miRNAs in VEX and TEX. Panel (A) shows a map of the MDV genome with the location and orientation of the miRNA clusters (Meq cluster 1, 2 and LAT cluster). Panel (B) shows the read numbers of the Meq cluster 1 miRNAs in leghorn VEX (top) and TEX (bottom) showing reads for individual chickens. Note differences in y-axes (3000 vs. 35,000). Panel (C) shows the Meq cluster 2 (downstream of the meq gene) miRNA reads for leghorn VEX (top) and TEX (bottom). Panel (D) shows the individual reads of the LAT cluster of miRNAs from leghorn VEX (top) and TEX (bottom).

