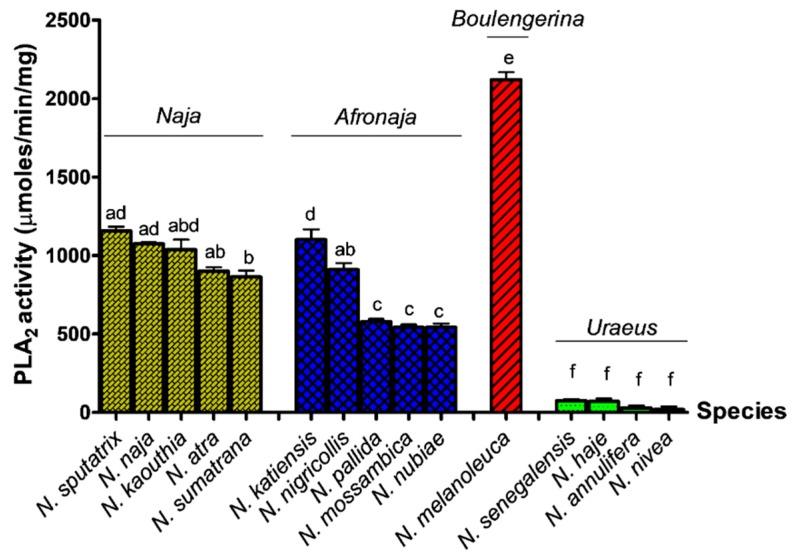
Figure 1.
Comparison of venom phospholipase A2 activities in acidimetric assay among the venoms of four subgenera of cobra. Values are expressed as mean ± S.E.M. of triplicates. Statistical analysis difference was performed by one-way analysis of variance (ANOVA) and Tukey’s post hoc test, where the statistical significance (p < 0.05) is indicated by different lower-case letters at the top of the bars. Bars without any common lowercase letter denote values that are significantly different (p < 0.05).

