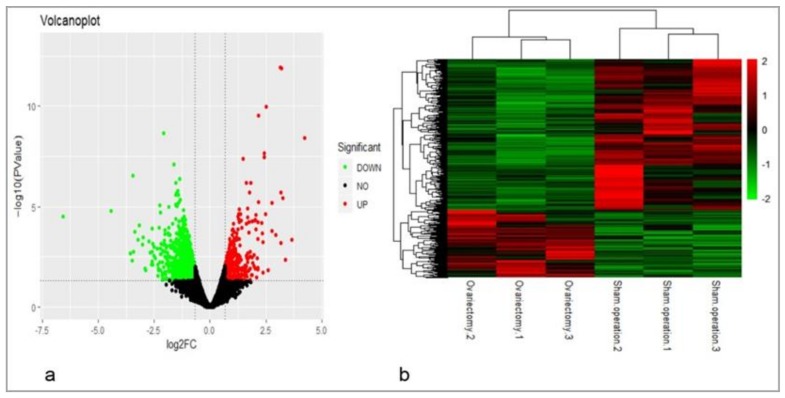
Figure 2.
Volcano plot and cluster analysis of differentially expressed genes (DEGs). (a) Volcano plot. Red dots (UP) represent significantly up-regulated genes (log2 FC ≥ 0.58, p < 0.05); green dots (DOWN) represent significantly down-regulated genes (log2 FC ≤ −0.58, p < 0.05); black dots (NO) represent DEGs below the level of significance; (b) based on 1461 known DEGs in the AF tissue of the ovariectomized and sham-operated groups at 14 weeks post-surgery, cluster analysis was performed. The results show that the data in the gene expression profiling of chickens in same group were closely related.

