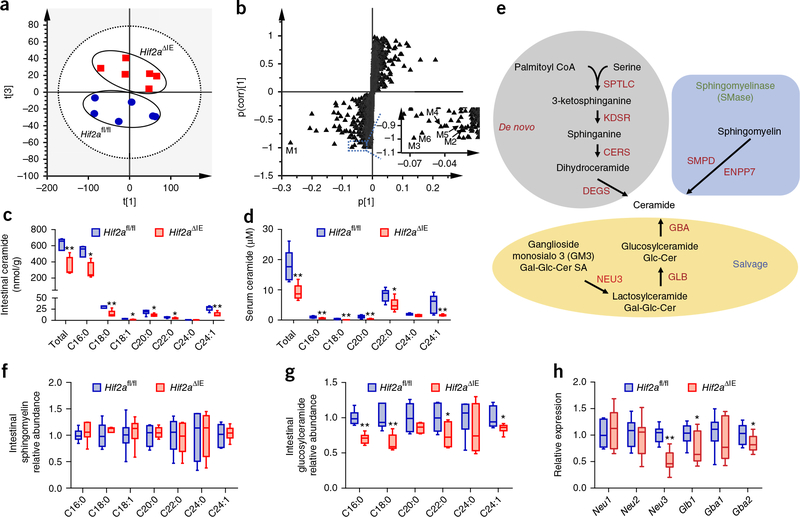
Figure 3.
Intestinal HIF-2α deficiency reduces ceramide synthesis in the small intestine. (a) Score scatter plot of a PCA model of the intestinal metabolites between Hif2αfl/fl (circle) and Hif2αΔIE (square) mice. Each point represents an individual mouse sample. (b) S-plot of an orthogonal partial least-squares discriminant analysis (OPLS-DA) model of the intestinal metabolites. Each point represents a metabolite ion. Insert shows a scaled region with metabolites M2–M6. (c,d) Quantitation of ceramide concentrations in the small intestine (c) and serum (d). (e) Scheme for ceramide-synthesis pathways. (f,g) The relative levels of sphingomyelin (f) and glucosylceramide (g) in the small intestine. (h) Intestinal expression of intestinal mRNAs encoding ceramide salvage-related enzymes. Hif2afl/fl and Hif2aΔIE mice fed a HFD for 12 weeks. n = 6/group. Data are presented as mean ± s.e.m. For box plots, the midline represents the median; box represents the IQR between the first and third quartiles, and whiskers represent the lowest or highest values within 1.5 times IQR from the first or third quartiles. *P < 0.05, **P < 0.01 relative to Hif2afl/fl mice, by two-tailed Student’s t-test.

