
Figure 2. Disinhibition of panic network (with l-AG) was associated with an increase in the excitability of BLA pyramidal neurons.
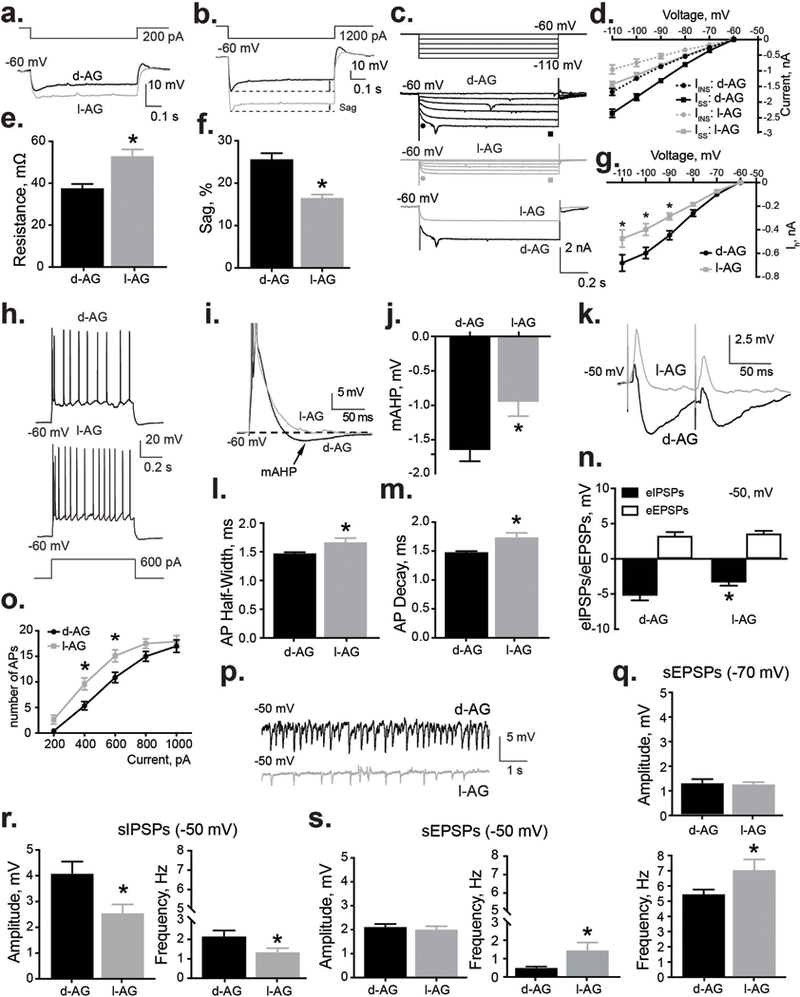
a,e) BLA neurons from I-AG animals (n = 14) displayed higher input resistance compared to d-AG controls (n = 19). a) Representative whole cell voltage responses to 600 pA current 700 ms pulses from the BLA of l-AG and d-AG animals. e) Group data indicating significantly higher input resistance in BLA neurons recorded from l-AG animals (l-AG, n = 9) compared to d-AG controls (d-AG, n = 14). b,f) BLA neurons from l-AG animals (n = 17) have smaller inward rectification (sag) compared to d-AG controls (n = 15). b) Whole cell voltage responses to 1200 pA current 700 ms pulses from the BLA neurons of l-AG and d-AG animals. f) Summary of the sag amplitude in d-AG and l-AG animals. c,d,g) Ih was suppressed in BLA neurons from l-AG animals (n = 14) compared to d-AG controls (n = 12). c) Representative current traces of Ih induced by applying hyperpolarizing voltage steps from −60 to 120 mV (step = −10 mV) in d-AG (top) and l-AG animals (middle). Representative examples of raw current traces (bottom) in response to voltage step to −110 mV from −60 mV. d) Plots of instantaneous current (Iins, ● and ●, as shown in (c) and steady state currents (Iss, ■ and ■, as shown in (c) against the membrane potential in the BLA neurons from l-AG (n = 14) and d-AG animals (n = 12). g) Plots of Ih against the membrane potential in the BLA neurons from l-AG (n = 14) and d-AG animals (n = 12). Note that the difference between Iss and Iins corresponds to Ih. *p < 0.05, ANOVA, Sidak’s between subjects posthoc analysis. h) and o) Depolarizing currents induced significantly more APs in neurons recorded from l-AG animals (n = 19), compared to d-AG animals (n = 14). *p < 0.05, ANOVA, Sidak’s between subjects posthoc analysis. i) Example traces showing the voltage response to current step used to induce a mAHP (APs are truncated). j) Group data indicating significant effect of l-AG treatment (l-AG, n = 9) on the amplitude of mAHP (d-AG, n = 14). l) Half-width and m) decay of APs of BLA neurons from l-AG animals (n = 16) were significantly different compared to d-AG rats (n = 16). k) Example traces of ePSPs in the BLA neurons from l-AG and d-AG animals. n) Group data showing that l-AG treatment significantly reduced amplitude of eIPSPs without affecting amplitude of eEPSPs (n = 18). p) Representative recordings of spontaneous activity in l-AG and d-AG animals. r) Group data showing that amplitude and frequency of sIPSPs were significantly reduced in l-AG animals (n = 16) compared to d-AG rats (n = 18) at holding potential of −50 mV. s,q) Group data showing that frequency, but not amplitude of sEPSPs were significantly increased in l-AG animals (n = 16) compared to d-AG control (n = 18) at holding potential of −50 mV (s) and −70 mV (q). Except where otherwise specified, *p < 0.05, t-test. All data reported as mean + S.E.M.