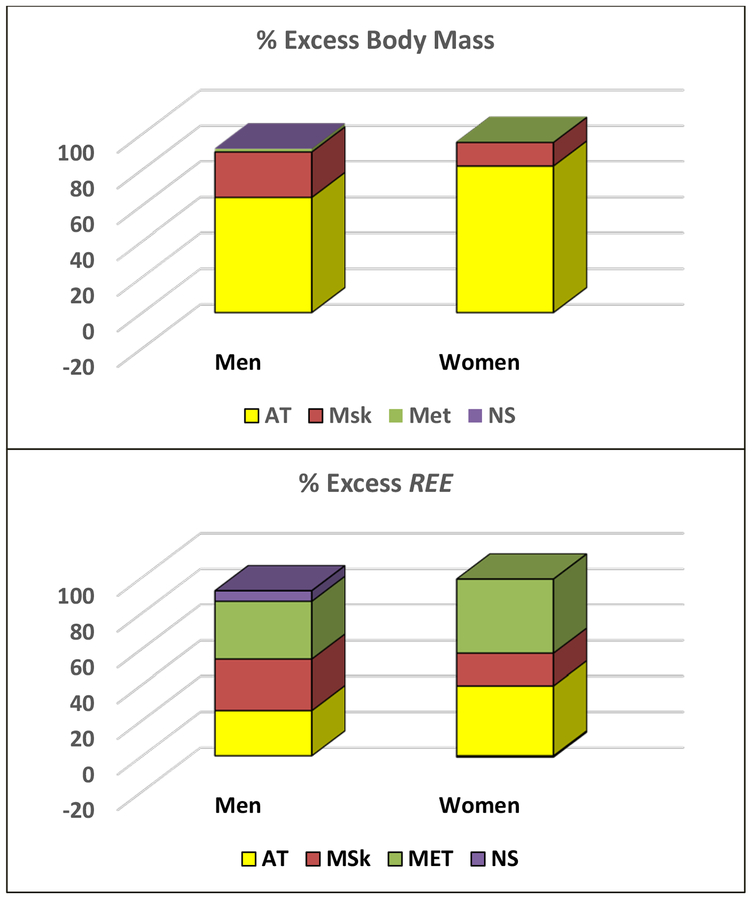
Figure 3.
Percent (%) of excess body mass (upper panel) and % of excess resting energy expenditure (REE) (lower panel) observed in a sample of healthy men (n=15 pairs) and women (n=17 pairs) matched on age and height but who differed in level of adiposity (upper and lower fifths of the sample) [18]. Between-pair mean differences for body systems and adipose tissue are shown in the figure as a % of body mass or calculated REE [11] differences. AT, adipose tissue; MET, metabolic system (liver, heart, kidneys); MSk, musculoskeletal system; and NS, nervous system (brain).

