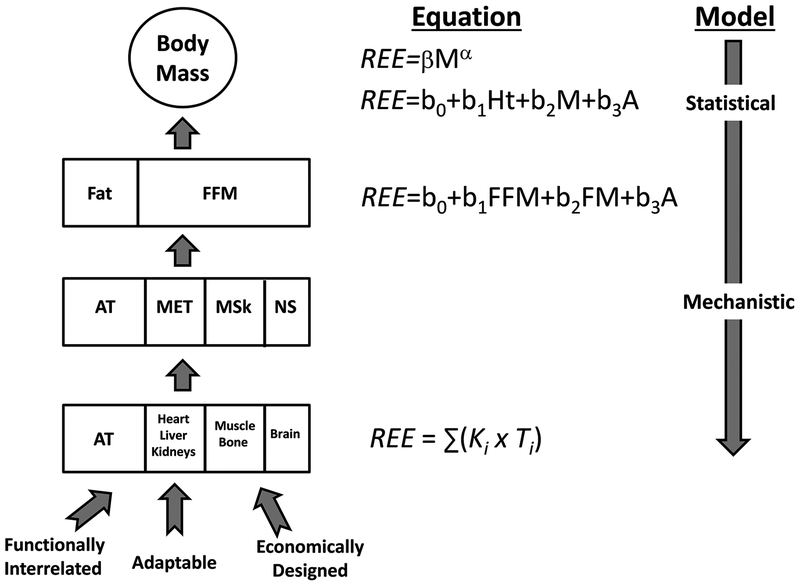
Figure 4.
Relationships between body mass, body composition, and resting energy expenditure (REE) prediction models. Concepts relating organ structure, function, and mass are shown in the figure. A is age; α is the scaling exponent; AT is adipose tissue mass; β is a proportionality coefficient; b0 and bn are regression model intercepts and slopes, respectively; FFM is fat-free mass; Ht is height; Ki is mass-specific metabolic rate; MET is metabolic system; MSk is muscular skeletal system; NS is nervous system; S is sex; and Ti is organ mass.

