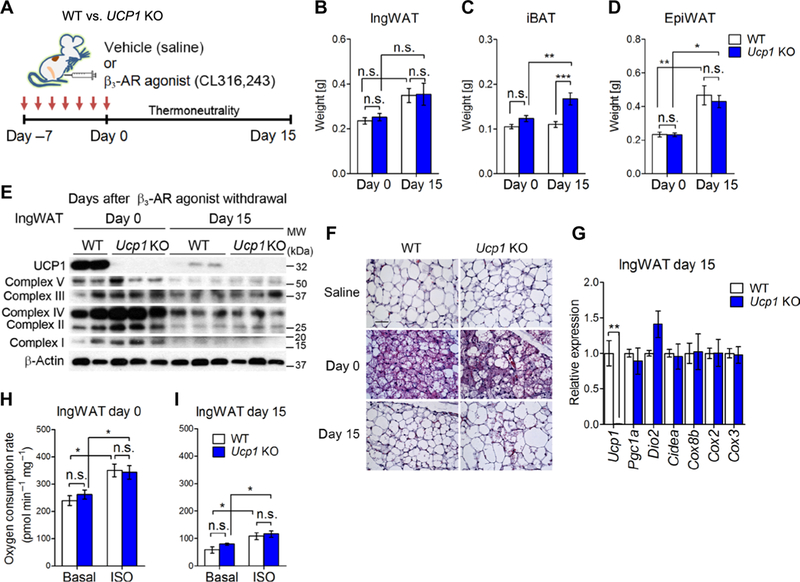
Fig. 3. UCP1 is dispensable for beige adipocyte maintenance in vivo.

(A) Schematic illustration of the experiments. Ucp1 KO mice and control mice were treated with the β3-AR agonist CL316,243 or vehicle (saline) for seven consecutive days. Adipose tissue samples were harvested at days 0 and 15 after β3-AR agonist withdrawal under thermoneutrality (30°C). (B) Tissue weight of the IngWAT of control and Ucp1 KO mice at days 0 and 15 after β3-AR agonist withdrawal. *P < 0.05, **P < 0.01, and ***P < 0.001 by two-way ANOVA with post hoc test by Tukey’s method. n = 6 to 8 mice per group. Data are mean ± SEM. (C) Tissue weight of the iBAT in (B). (D) Tissue weight of the epididymal WAT in (B). (E) Representative immunoblotting for UCP1 and mitochondrial complexes (as indicated) in the IngWAT of control and Ucp1 KO mice treated with CL316,243 at days 0 and 15.β-Actin was used as a loading control. The molecular weight is shown on the right. Data are representative of three independent experiments. (F) Hematoxylin and eosin staining in the IngWAT of mice in (E). Vehicle (saline)-treated mice were shown as a reference. Scale bar, 100 μm. n = 3 mice per group. (G) Relative mRNA expression of thermogenic genes (as indicated) in the IngWAT of control and Ucp1 KO mice at day 15 after β3-AR agonist withdrawal. **P < 0.01 by unpaired Student’s t test. n = 3 mice per group. Data are mean ± SEM. (H) OCR in the IngWAT of control and Ucp1 KO mice at day 0 after β3-AR agonist withdrawal. OCR data were shown per 1 mg of tissue. Tissues were treated with isoproterenol or vehicle (basal). *P < 0.05 by two-way ANOVA with post hoc test by paired or unpaired t test. n = 6 mice per group. Data are mean ± SEM. (I) OCR in the IngWAT of control and Ucp1 KO mice at day 15 after β3-AR agonist withdrawal. *P < 0.05 by two-way ANOVA with post hoc test by paired or unpaired t test. n = 6. Data are mean ± SEM.
