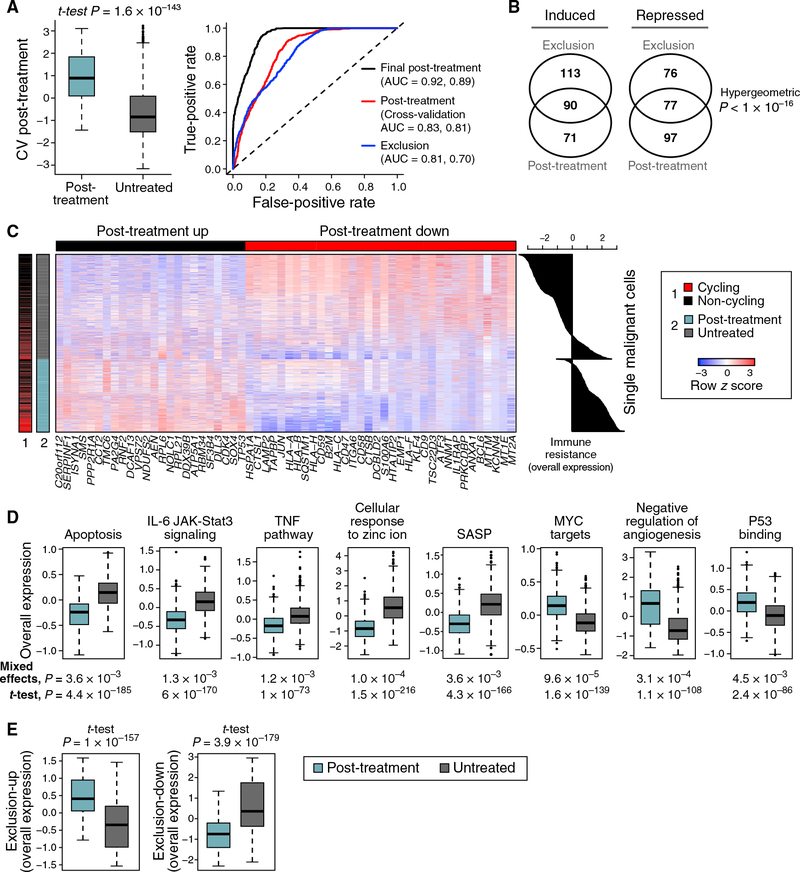
Figure 2. Exclusion and Resistance Programs Characterizing Individual Malignant Cells from Patients with Resistance to ICIs.
(A) Post-treatment program in malignant cells. Left: OE of the post-treatment program in malignant cells from post-treatment (blue) and untreated (gray) patients tested on withheld data (STAR Methods). Middle line: median; box edges: 25th and 75th percentiles; whiskers: most extreme points that do not exceed ± interquartile range (IQR) × 1.5; further outliers are marked individually. Right: the performances of different programs in classifying cells as post treatment or untreated; the first and second area under the curve (AUC) values are for classifying cells and samples, respectively.
(B) Significant overlap between the exclusion and post-treatment programs.
(C) Expression (centered and scaled, color bar) of the top genes (columns) in the post-treatment program across malignant cells (rows) sorted by untreated or post-treatment tumors (blue/gray color bar, left). Leftmost color bar: cycling (red) and non-cycling (black) cells. Right: OE of the post-treatment program.
(D) Distribution of OE scores (as in A) of differentially expressed gene sets in malignant cells from post-treatment (blue) and untreated (gray) tumors.
(E) Distribution of OE scores (as in A) of the exclusion program in malignant cells from post-treatment (blue) and untreated (gray) tumors.

