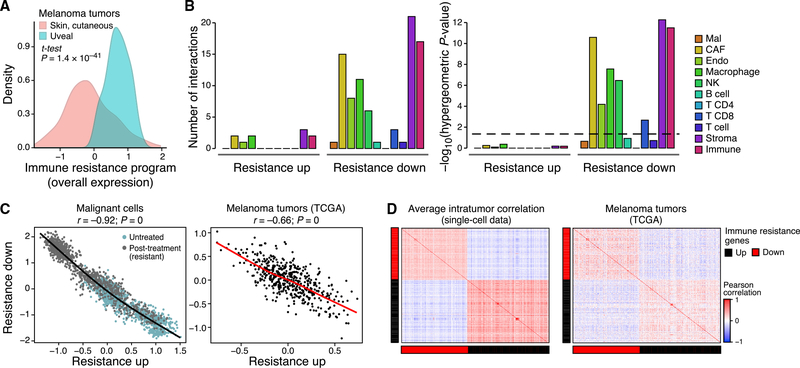
Figure 3. The Resistance Program Is a Coherently Regulated Module that Represses Cell-Cell Interactions.
(A) Distribution of program OE scores in cutaneous (pink) versus uveal (blue) melanoma from TCGA after filtering microenvironment contributions (STAR Methods).
(B) Right: Number of genes in each part of the program that mediate physical interactions with other cell types (color) and the significance of the corresponding enrichment. Dashed line: statistical significance.
(C and D) Co-regulation of the program.
(C) OE of the induced and repressed parts of the immune resistance programs in malignant cells (left, scRNA-seq data) and cutaneous melanoma tumors (right, TCGA RNA-seq data after filtering microenvironment signals). Pearson correlation coefficient (r) and p value are marked.
(D) Pearson correlation coefficients (color bar) between the program’s genes across malignant cells from the same tumor (left, average coefficient) or across cutaneous melanoma from TCGA (right, after filtering microenvironment effects).
See also Figure S3.

