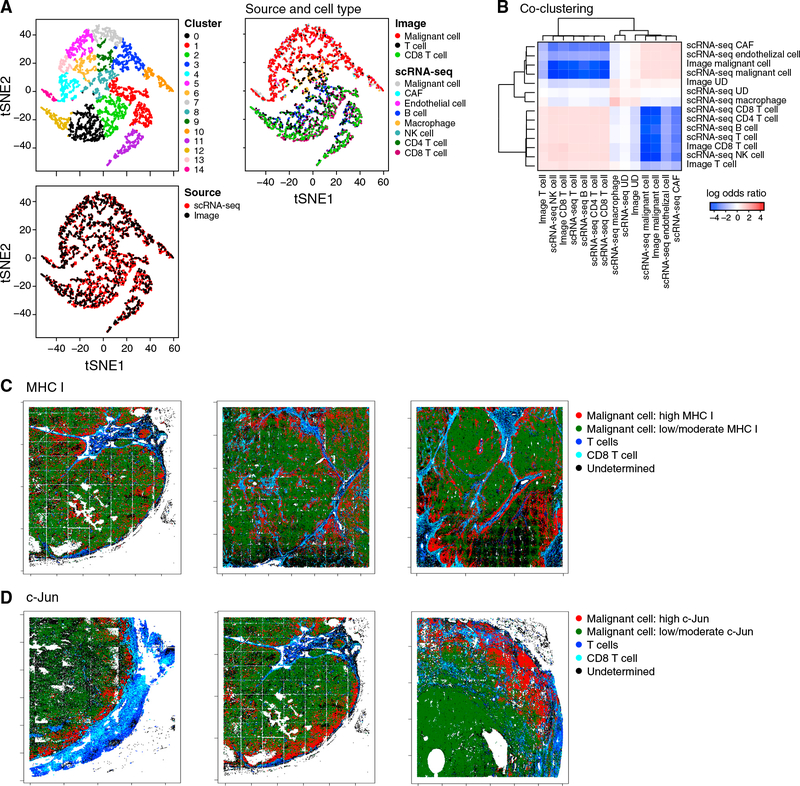
Figure 4. The Resistance Program Is Associated with the Cold Niche In Situ.
(A and B) Congruence of in situ multiplex protein and scRNA-seq profiles.
(A) Co-embedding of profiles from scRNA-seq and multiplex imaging of the Mel112 tumor (others in Figure S4), with cells colored by clusters (top left), data source (bottom left), or source and cell type (right).
(B) Log-odds ratio (color bar; STAR Methods) assessing for each pair of cell types (rows, columns) if they are assigned to the same cluster significantly more (>0, red) or less (<0, blue) than expected by chance.
(C and D) Multiplex imaging relates program genes to hot or cold niches. Malignant cells expressing high (red) or low/moderate (green) levels of the MHC class I (C) and c-Jun (D) proteins and their proximity to CD3+ T cells (blue) or CD3+CD8+ T cells (cyan) in three representative tumors.
See also Figure S4.

