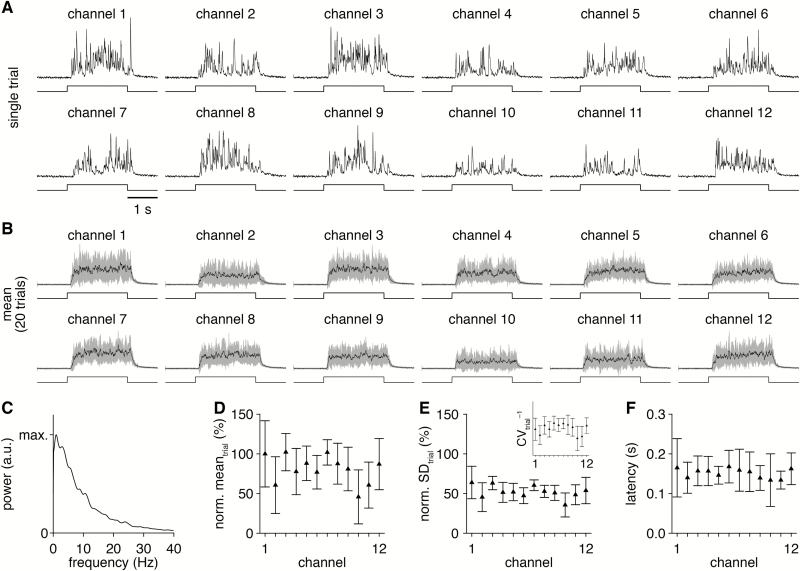
Figure 3.
Comparable odorant delivery across 12 distinct channels. (A) PID recordings (upper) during single trials of 2-s-long valve openings (lower) from each olfactometer channel. (B) Mean PID recording across 20 trials for each olfactometer channel. (C) Mean power spectrum, averaged across all channels and trials. (D and E) PID recording mean (D) and SD (E) during the odorant delivery for each channel (normalized to the channel 1 mean). Inset: inverse of the coefficient of variation for each channel, reflecting the strength of odorant delivery relative to the delivery variability. (F) Mean latency of odorant delivery for each channel.

