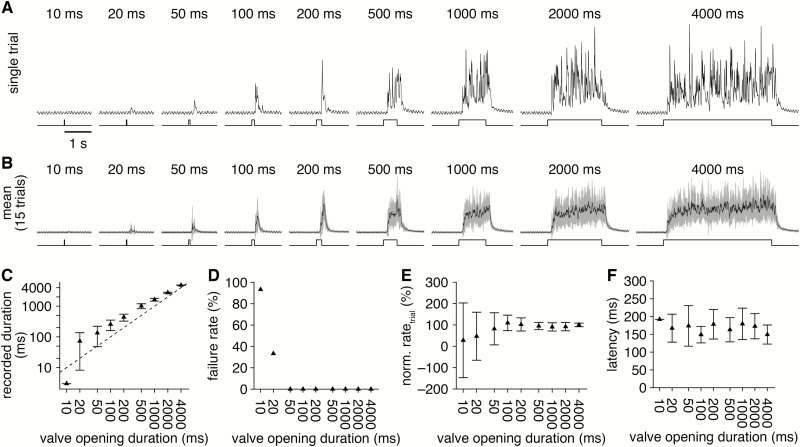
Figure 7.
Tightly controlled odorant delivery duration. (A) PID recordings (upper) during single trials of odorant delivery with increasing valve opening duration (lower) from a single olfactometer channel. (B) Mean PID recording across 15 trials for each valve opening duration tested. (C) Mean duration of odorant delivery detected for increasing valve opening duration. Axes plotted on a log-scale. Dashed line: unity. (D) Mean odorant delivery failure rate (i.e., percent of trials with no detectable odorant-evoked PID signal) for increasing valve opening duration. (E) Mean odorant delivery rate, calculated as the PID recording mean divided by the valve opening duration (normalized to the mean delivery rate with 4000-ms-long valve opening duration). (F) Mean latency of odorant delivery for increasing valve opening duration.

