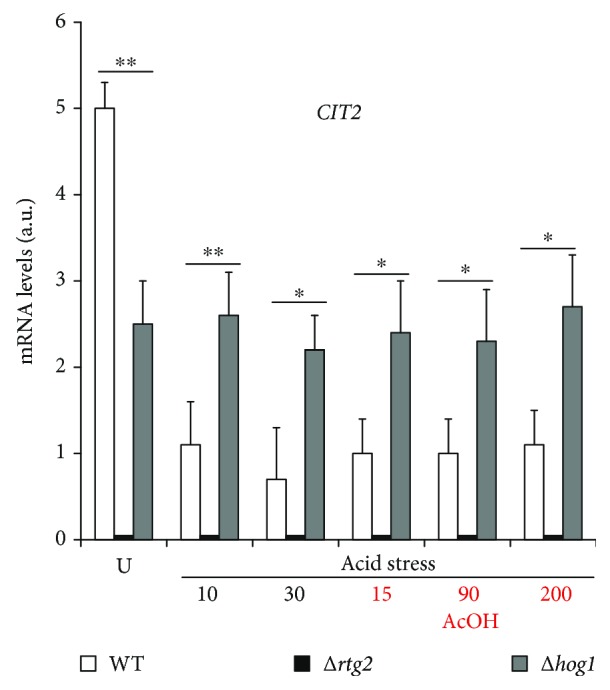
Figure 4.

CIT2 expression in ∆hog1 mutants. Cells were grown up to exponential phase (U), incubated at low pH, and treated with acetic acid (AcOH). CIT2 mRNA levels were measured by real-time PCR at the indicated times in WT and mutant cells from three independent experiments. CIT2 mRNA levels were normalized to that of ACT1 mRNA and reported as means with standard deviation in fluorescence arbitrary units (a.u.). Paired Student's t-test: statistically significantly different with ∗∗p < 0.1 when comparing WT versus Δrtg2 and Δhog1 in untreated cells and at 10 min low pH and with ∗p < 0.5 when comparing WT versus Δhog1 and Δrtg2 at 30 min low pH and with acetic acid.
