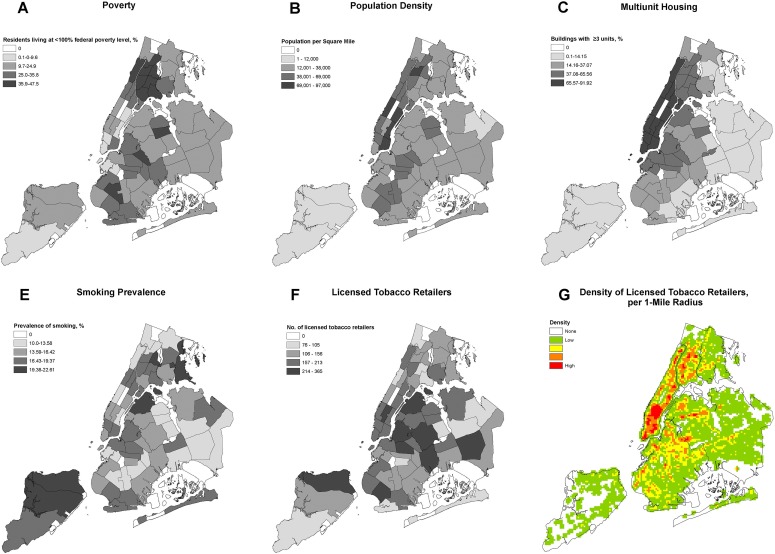
Figure 1.
Distribution of income levels, population density, multiunit housing, public housing, smoking prevalence, and licensed tobacco retailers, by neighborhood, New York City, 2011-2013. (A) Prevalence of low-income residents (ie, residents living at <100% of the federal poverty level), 2011-2013 New York City Community Health Survey.20 (B) Population density per square mile, 2009-2013 American Community Survey.24 (C) Percentage of residents living in multiunit housing (ie, ≥3 units), 2012 New York City Primary Land Use Tax Lot Output.26 (D) Percentage of residents living in New York City Housing Authority housing (ie, public housing), 2012 New York City Primary Land Use Tax Lot Output.26 (E) Percentage of residents who smoke, 2011-2013 New York City Community Health Survey.20 (F) Number of tobacco retailers, 2012 Department of Consumer Affairs.21 (G) Density of licensed tobacco retailers per 1-mile radius, 2012 Department of Consumer Affairs.21

