Fig. 1.

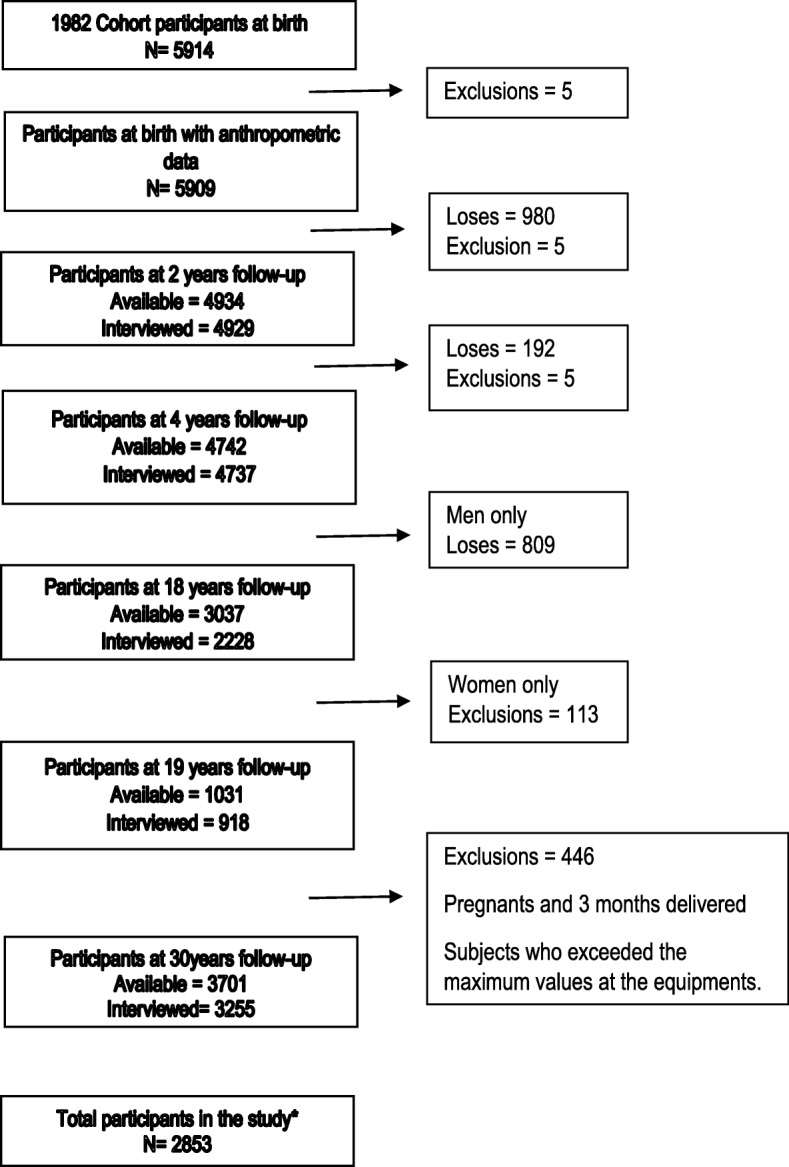
Flow chart of the Pelotas 82 cohort Participants. *All the subjects that had height and weight measurement during childhood, adolescence and adulthood

Flow chart of the Pelotas 82 cohort Participants. *All the subjects that had height and weight measurement during childhood, adolescence and adulthood