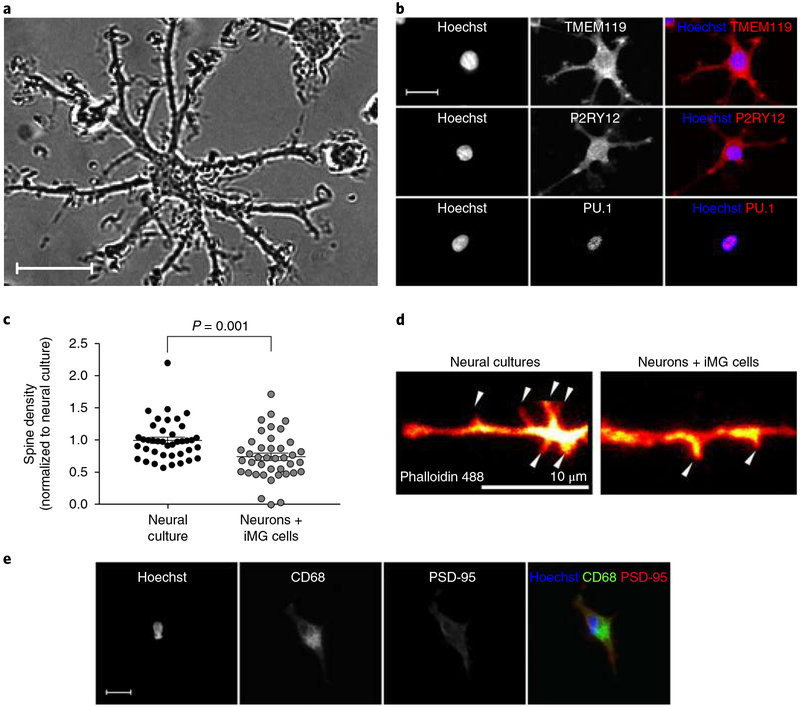
Fig. 1 |. Characterizations of iMG cells.
a, Representative phase-contrast image of iMG cells captured during a live imaging session (repeated in 3 independent experiments with 36 images collected per session and similar results). Scale bar, 20 μm. b, Confocal images of iMG cells stained for TMEM119, P2RY12, and PU.1. Images are representative of 3 independent experiments with 20 images collected per experiment. Scale bar, 20 μm. c, Spine density (spines per 10-μm dendrite) in an iPSC-derived neural line with and without coculture with iMG cells (derived from 2 individuals) for 48 h (n = 40 randomly selected dendrites examined per group). Data are normalized to neural culture only and were analyzed using a t test (equal variance); t(78) = 3.40, P = 0.001 (two-sided). Mean ± s.e.m. is indicated for each group. d, Phalloidin 488-stained dendrite of an iPSC-derived neuron in pure culture and cocultured with iMG cells for 48 h.; arrows indicate dendritic spines. Images are representative of the experiments described in c. Scale bar, 10 μm. e, Colocalization and engulfment of PSD-95 (red) by iMG cells (green, CD68) in coculture. Images are representative of 3 independent experiments with 20 images collected per experiment. Scale bar, 30 μm.

