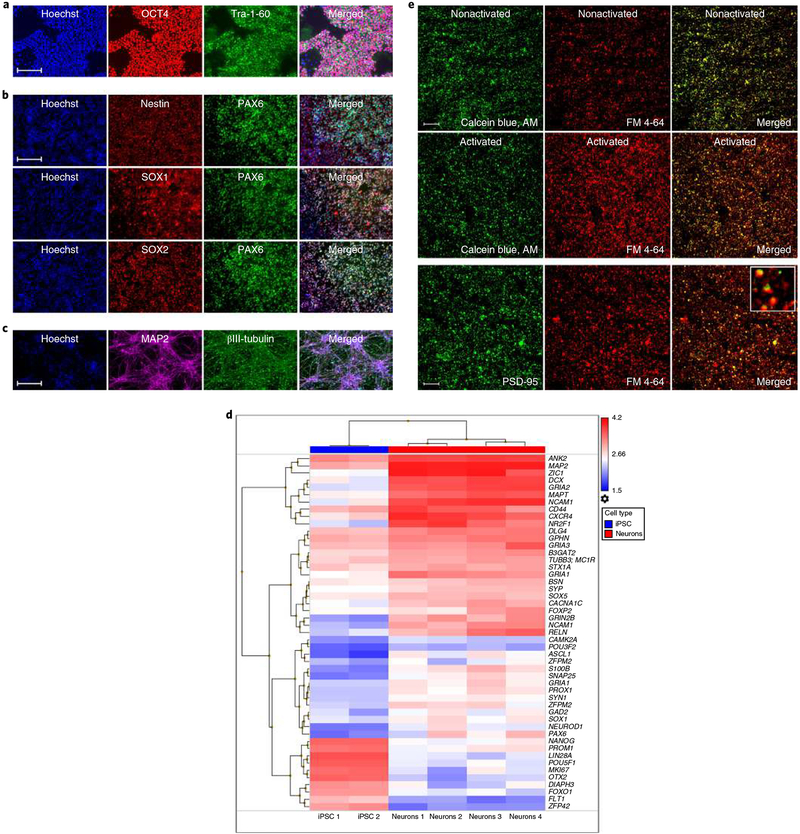
Fig. 2 |. Isolation of active synaptic structures from iPSC-derived neural cultures.
a, iPSCs stained for octamer-binding transcription factor (OCT4; POU domain, class 5, transcription factor 1) or Tra-1–60 as indicated. b, iPSC-derived NPCs stained for nestin, paired box protein Pax-6 (PAX6), transcription factor SOX1, or transcription factor SOX2 as indicated. c, Neurons stained for the neuronal markers tubulin beta-3 chain (βIII-tubulin) and microtubule-associated protein 2 (MAP2). Images in a–c are representative of 8 independent experiments with 20 images collected per well in each experiment. Scale bars, 100 μm. d, Heat map of mRNA expression values determined in iPSCs (n = 2 patients) and iPSC-derived neurons (n = 4 patients); for details see Supplementary Table 5. e, Confocal images of SYNs labeled with calcein blue, AM and FM 4–64 (first and second rows). SYNs were activated by the addition of 40 mM KCl as indicated. The last row displays SYNs labeled with FM 4–64 and the synaptic marker PSD-95. Images are representative of experiments performed in 8 independent patients with 40 images collected in cell culture triplicates per experiment. Scale bar, 60 μm.

