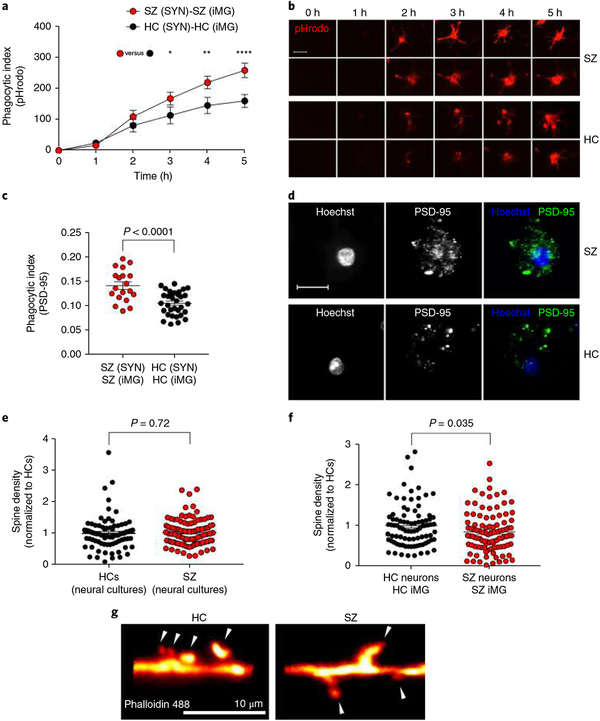
Fig. 3 |. Increased engulfment of synaptic structures in schizophrenia-derived models.
a, Quantification of pHrodo (red)-labeled SYN uptake in iMG cells during live imaging. The phagocytic index represents the mean pHrodo+ area per iMG cell. SZ-derived models were designed by using iMG cells derived from 13 patients and SYNs derived from 3 patients (combined to form n = 13 SZ (SYN)-SZ (iMG) models), while HC models were derived from 9 HCs and SYN from 3 HCs (both groups matched with correspondent SZ patients); n = 13 HC (SYN)-HC (iMG) models. Nine images (20×) per well were automatically acquired every hour and the means were then extracted and analyzed using a two-way repeated ANOVA. There was a significant interaction between the effects of time and group on phagocytic index (F(5,60) = 4.84; P = 0.0009). Šidák’s multiple comparison tests gave an adjusted P value of 0.035 at 3 h, 0.002 at 4 h, and < 0.0001 at 5 h. All other comparisons were non-significant. b, The first two rows display representative images from the SZ models in a; the last two rows represent images from the HC models in a. Scale bar, 25 μm. c, Quantification of phagocytic inclusions (PSD-95+ inclusions, 0.5–1.5 μm) using confocal microscopy in a sample containing SYNs derived from a total of 4 SZ patients and 4 matched HCs, combined in different combinations with iMG cells from 13 SZ patients and 18 matched HCs (n = 19 SZ (SYN)-SZ (iMG) models and n = 33 HC (SYN)-HC(iMG) models). The phagocytic index represents the number of PSD-95+ particles (0.5–1.5 μm) per iMG cytoplasm area. Twenty randomly selected confocal images were taken per well and the means were analyzed using a t test (equal variance); t(50) = 4.55, P < 0.0001 (two-sided). d, Representative confocal images for the two groups in c. Scale bar, 30 μm. e, Quantification of spine density (spines per 10-μm dendrite) in neural lines derived from 3 SZ patients versus 2 HCs (n = 80 randomly selected dendrites examined in the SZ group and n = 100 randomly selected dendrites examined in the HC group); Welch-corrected t test; t(148) = 0.35, P = 0.72 (two-sided). f, Quantification of spine density in the same neural lines but cocultured with iMG cells (derived from 3 SZ patients or 2 HCs; n = 88 randomly selected dendrites examined in HC group and n = 99 randomly selected dendrites examined in the SZ group) as indicated; t test (equal variance); t(185) = 2.1, P = 0.035 (two-sided). Data in both graphs are normalized to the HC group. g, Representative images of phalloidin 488-stained high-magnification confocal images of dendritic spines (indicated by the arrowheads) in HC and SZ neural cultures described in f. The mean number of spines per 10-μm dendrite was 4.5 (s.e.m. = 0.25) for HC cultures and 3.8 (s.e.m. = 0.23) in SZ cultures. All reported P values are two-sided; the mean ± s.e.m. is indicated for each group in all graphs. *P < 0.05, **P < 0.01, ****P < 0.0001.

