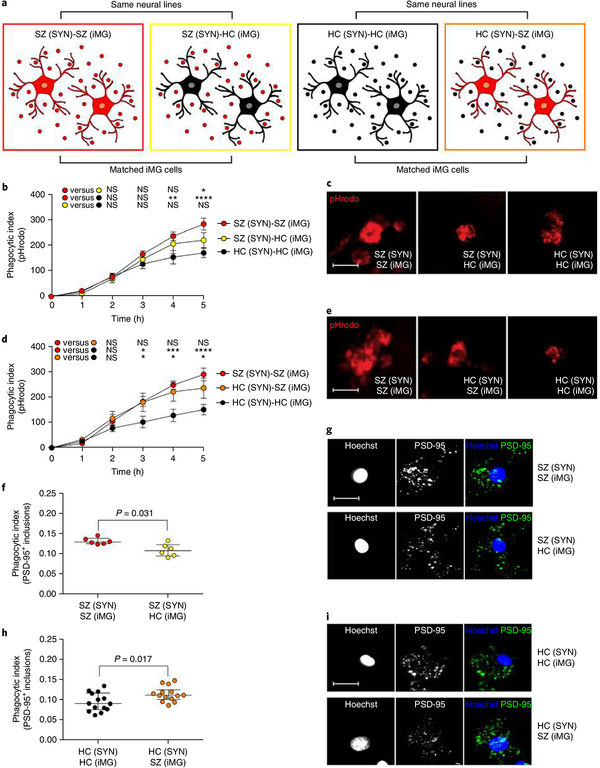
Fig. 4 |. Microglial factors influence synapse engulfment.
a, ‘Pure’ disease models, derived from patients with SZ, were compared to ‘mixed’ models in which the same synaptic structures from SZ patients were added to iMG cells derived from matched HCs, as well as ‘pure’ HC models compared to ‘mixed’ models in which the same synaptic structures from HC patients were added to iMG cells derived from matched SZ patients. For both experimental designs, as a reference, we included matched ‘pure’ HC and SZ models, respectively. b, Quantification of pHrodo (red)-labeled SY) uptake in iMG cells during live imaging sessions of 5 h. SZ-SZ models were based on SYN from 2 SZ patients and iMG cells from 8 SZ patients (n = 8 models), while SZ-HC models were based on the same SYN from SZ patients and 8 models based on iMG cells derived from 7 matched HCs (n = 8 matched models). HC-HC models were based on iMG cells from 8 HCs and SYN from 3 HCs (n = 8 matched models). Nine images (20×) per well were automatically acquired every hour and the means were then extracted and analyzed using a two-way repeated ANOVA. There was a significant interaction between the effects of time and group on the phagocytic index (F(10,105) = 3.07; P = 0.0018). Šidák’s multiple comparison tests (across the three groups at every time point) gave an adjusted significant P value of 0.005 at 4 h for the SZ-SZ group versus the HC-HC group, and at 5 h for comparison of the SZ-SZ group versus the HC-HC group (P < 0.0001), as well as the comparison of the SZ-SZ group and the SZ-HC group (P = 0.042). All other comparisons were non-significant. c, Representative live images (5 h) from SZ-SZ, SZ-HC, and HC-HC models in the experiments described in b. d, Identical live imaging design as in b but in this experiment comparing HC-HC models (based on SYNs from 3 HCs and iMG cells from 5 HC patients; n = 7 models), with HC-SZ models based on the same SYN from HCs but iMG cells derived from 3 matched SZ patients (n = 7 matched models). SZ-SZ models were based on iMG cells from 7 SZ patients and SYNs from 3 SZ patients (n = 7 matched models). Data were analyzed using a two-way repeated ANOVA. There was a significant interaction between the effects of time and group on the phagocytic index (F(10,90) = 3.89; P = 0.0002). Šidák’s multiple comparison tests (across the three groups at every time point) revealed a significant different in phagocytic indexes at 3 h between the SZ-SZ group and the HC-HC group (adjusted P value = 0.031) as well as between the HC-HC group and the HC-SZ group (adjusted P value = 0.041). The mean difference was also stable for these comparisons at 4 h (SZ-SZ versus HC-HC: P = 0.0008; HC-HC group versus HC-SZ: P = 0.011) and at 5 h (SZ-SZ versus HC-HC: P < 0.0001; HC-HC group versus HC-SZ: P = 0.023). All other group comparisons were non-significant. e, Representative live images from the different combinations in d. Scale bar, 25 μ m. f, Quantification of phagocytic inclusions (PSD-95+ inclusions, 0.5–1.5 μ m) using confocal microscopy and SYNs derived from 2 neural SZ lines matched with iMG cells from 6 SZ patients or 6 matched HCs (n = 6 models per group) with representative confocal images in g; scale bar, 30 μ m. Wilcoxon signed-rank test: P = 0.031. h, Quantification of PSD-95+ inclusions using confocal microscopy and SYNs derived from 3 neural HC lines matched with iMG cells from 6 HCs or 6 matched SZ patients (n = 14 models per group), with representative confocal images in i; Scale bar, 30 μ m. Wilcoxon signed-rank test: P = 0.017. *P < 0.05, **P < 0.01, ***P < 0.001, ****P < 0.0001. All reported P values are two-sided. Mean ± s.e.m. is indicated in b and d; the median with the interquartile range is shown in f and h.

