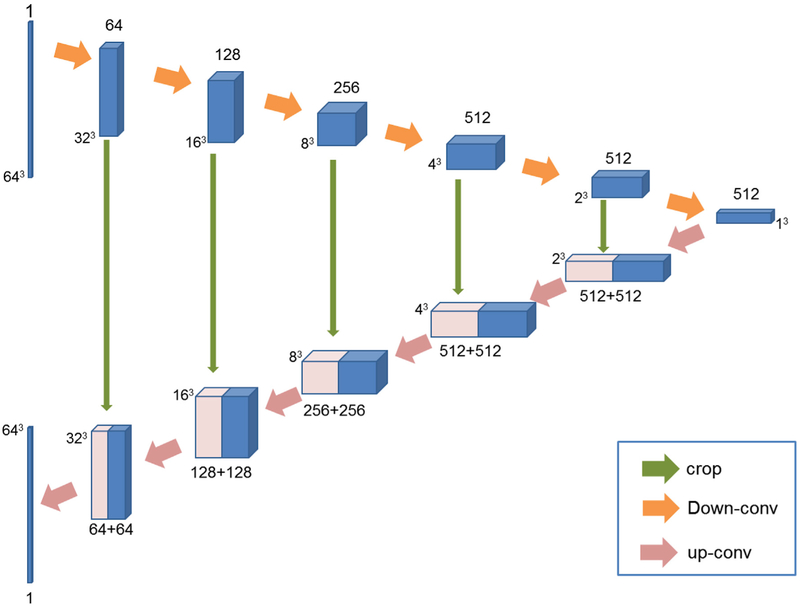
Fig. 2.
Architecture of the 3D U-net-like generator. Blue boxes represent feature maps while the pink boxes represent copied feature maps. The number of channels is denoted above/below (contracting part/expansive part) each feature map. (·)3 around the feature maps denotes the size of the 3D volumes. The arrows denote different operations.

