. 2015 Dec 17;1(3):180–189.

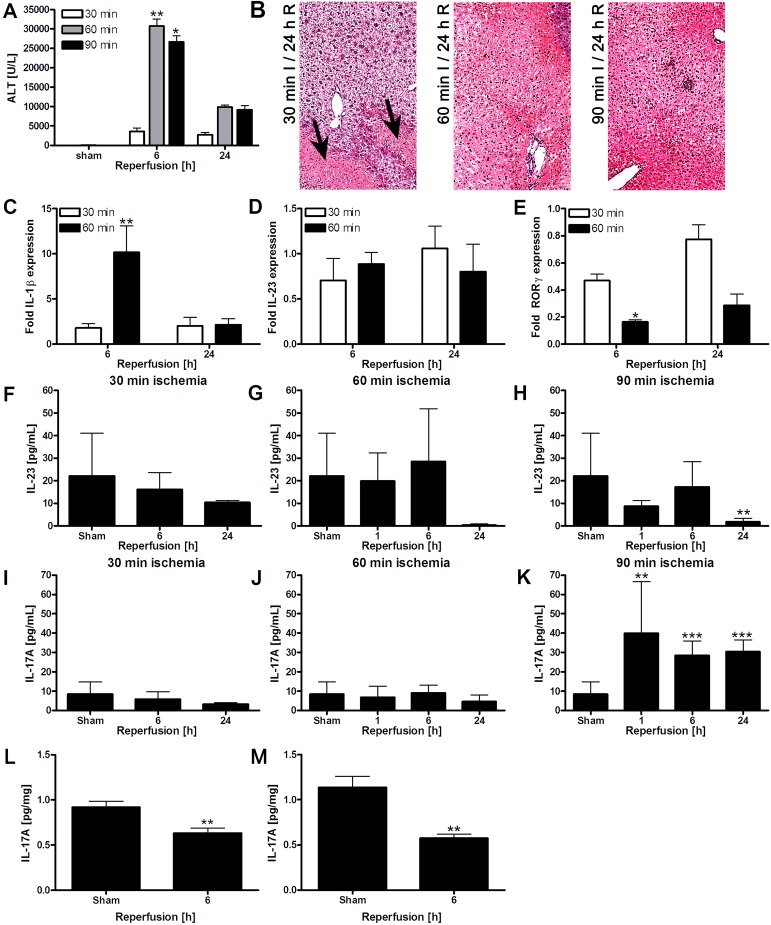
Figure 3. A: ALT levels during reperfusion following different ischemia times (N = 6-8 per group). B: H&E staining of livers subjected to 30-90 min of ischemia and 24 h of reperfusion. After 24 h, 20% necrosis was observed after 30 min ischemia (black arrows) versus 75-100% after 60-90 min ischemia. C-E: Liver IL-1β, IL-23, and RORγ mRNA expression following 30 or 60 min of ischemia and 6 or 24 h of reperfusion. Data are expressed as fold upregulation compared to the sham group (N = 3-5 per group). F-H: Plasma IL-23 levels determined by ELISA after 30, 60, or 90-min ischemia (N = 12 for sham and N = 4-9 for I/R groups). I-K: Plasma IL-17A protein levels after 30, 60, or 90 min of ischemia (N = 12 for sham and N = 4-9 for I/R groups). L: IL-17A protein levels after 60 min of ischemia in liver tissue homogenates (N = 8-10 per group). M: IL-17A protein levels after 90 min of ischemia in liver tissue homogenates (N = 6-9 per group). All data represent mean ± SEM.* p < 0.05, ** p < 0.01, and *** p < 0.001 compared to the sham group.

Figure 3.