. 2015 Jun 21;1(1):31–45.

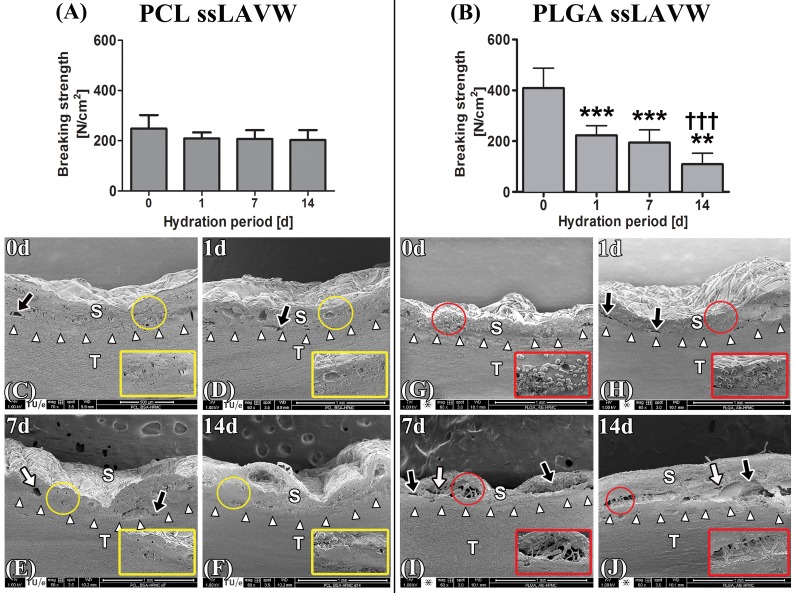
Figure 5. BS of PCL (A) and PLGA (B) ssLAVWed aorta strips plotted as a function of hydration period (n = 10/time point). Aortic strips were welded using BSA-HPMC solder and single spot irradiation. BS tests and SEM were performed after 1-, 7-, and 14 d of hydration. BS tests and SEM images taken directly after ssLAVW were used as the 0-d control specimens. The SEM images represent cross-sectional areas of PCL (C-F) and PLGA (G-J) ssLAVWed aortas on hydration days 0, 1, 7, and 14, respectively. White arrowheads point to the s-t interface, black arrows indicate separation gaps between the coagulated solder (S) and tissue (T), and white arrows designate the cavitations in the solder/scaffold coagulum. Red circles highlight intact PLGA fibers. An (*) designates the level of significance vs. 0 d of hydration and a (†) reflects the level of intergroup significance at the same time point.

Figure 5.