. 2015 Jul 19;1(1):6–21.

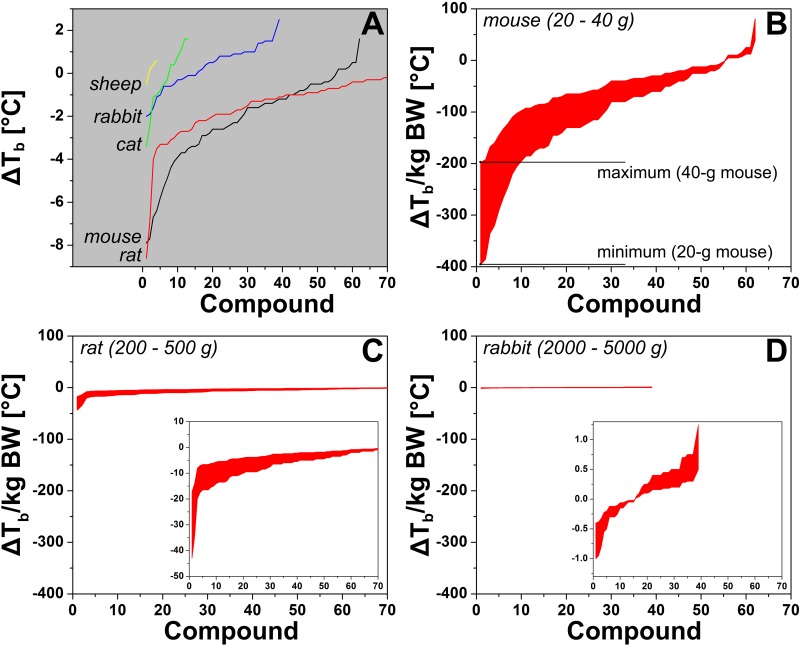
Figure 3. (A) Change in core body temperature (ΔTb) per species plotted as a function of compound with the most profound effect on Tb (1, x-axis) to the compound with the least effect on Tb (up to 70, x-axis). The ΔTb represents the mean of all ΔTbs reported for the respective compound in the respective species that were included in the analysis. Research data were included on the basis of the criteria described in section 3 and the legend of Figure 2. The complete data set containing all the species is provided in Table S3. The data were normalized to the maximum and minimum common body weights (BW) of laboratory mice (B), rats (C), and rabbits (D) and should be read vertically per compound, whereby the upper limit is the minimum ΔTb for the heaviest animals. The actual recorded values fall between the upper and lower bounds per compound. Note the different y-axis scaling of the inset plots. Common body weights were obtained from the internet (e.g., laboratory animal providers such as Harlan and Charles River).

Figure 3.