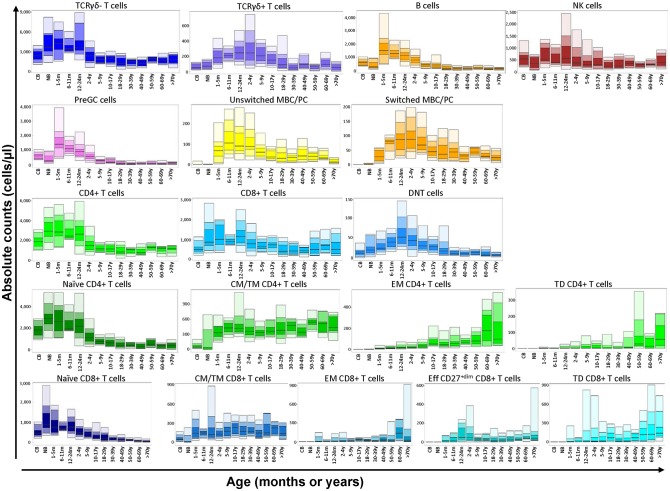
Figure 2.
Flow cytometric analysis of B- and T-cell populations using the EuroFlow PIDOT in 250 healthy controls in 14 different age ranges. All values of this reference data set are displayed as bar graphs representing the median, minimum, maximum, and p10, p25, p75, and p90 percentiles. For data visualization package gplot2 for the statistical language R was used (10).

