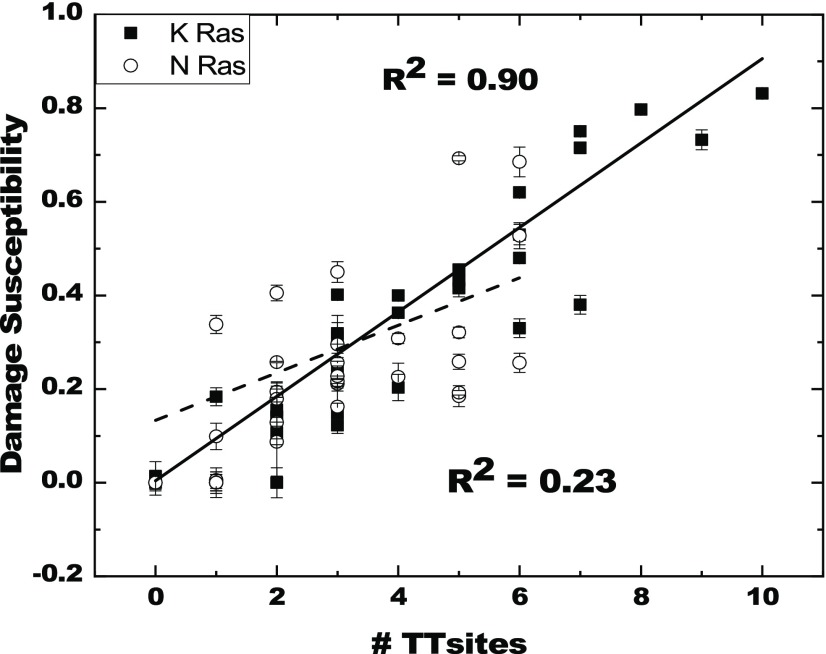
Figure 1.
UVC damage susceptibility (1 – F) as a function of the number of TT dinucleotide sites for K-Ras and N-Ras. The damage susceptibility on the y-axis is 1 – F, where F = Fi/Fc, Fi is the fluorescence intensity of EG-dsDNA upon UVC damage and Fc is the fluorescence intensity of the undamaged DNA-EG control sample. The EG dye fluorescence intensity at 530 nm is measured in the presence of 1 μM dsDNA (10 mM Tris, 1 mM ethylenediaminetetraacetic acid (EDTA), 10 mM NaCl, pH 7.4). The solid line through the filled square points is a linear fit for the K-Ras sequences with its R2 value indicated in the upper portion of the plot. The dashed line through the empty circle points is the linear fit for the N-Ras sequences with its R2 value indicated in the lower portion of the plot.

