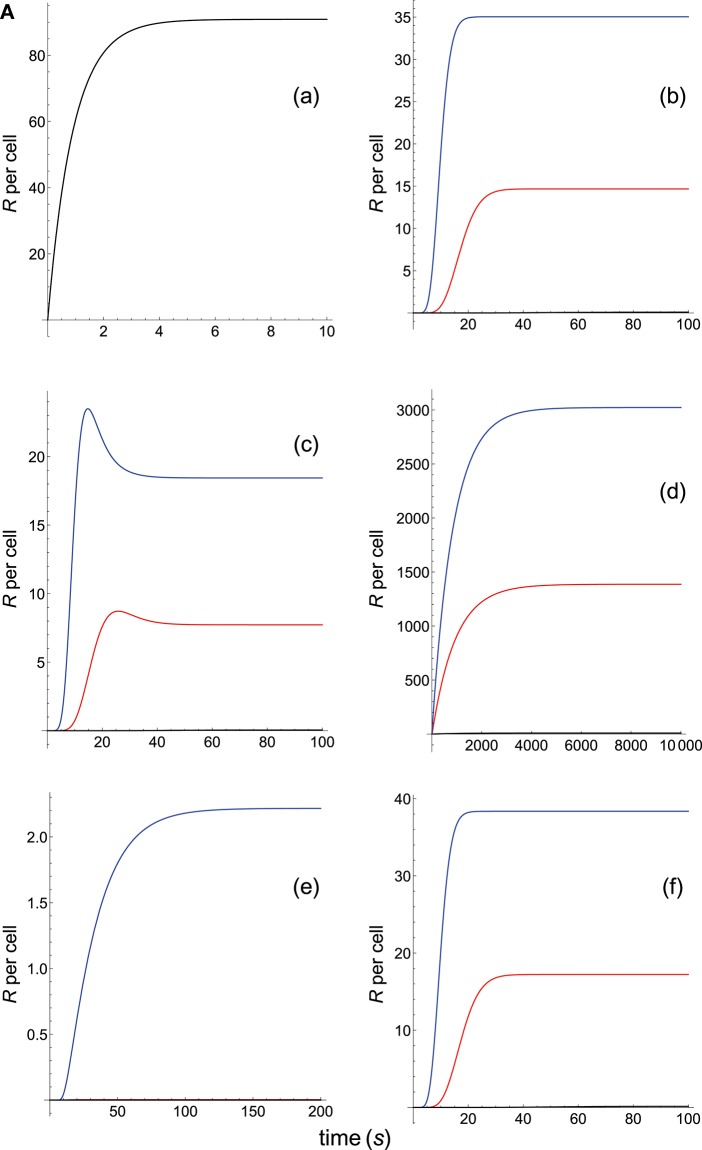
Figure 7A.
Dependence of the values of R on time for three systems with equal affinity (A = 10kon, ), but different values of : system 1: kp = 1 (blue); system 2: kp = 0.5 (red); system 3: kp = 0.1 (black). Panel models: (a) occupancy model; (b) basic kpr; (c) kpr with limited signaling; (d) kpr with sustained signaling; (e) kpr with negative feedback; (f) kpr with induced rebinding. In some cases, R-values are so small that their plots are almost coincident with the x-axis. Other conditions as in Figure 2A.

