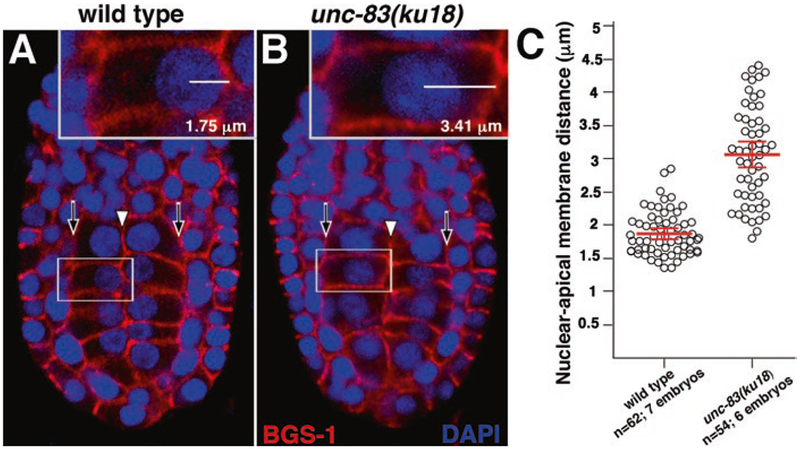
Fig. 3.
Nuclear migration in the C. elegans intestinal primordium. Wild-type and unc-83(ku18) E16 stage embryos were stained with a cortical marker (anti-BGS-1, red) and a nuclear dye (DAPI, blue). (A, B) Representative single optical sections from a ventral view (anterior up) are shown with white arrowheads denoting the apical surfaces and black arrows denoting the basal surfaces of intestinal cells. The nuclear apical membrane distance was determined by measuring the distance between the center of the nucleus and the apical membrane (insets). (C) Each circle represents the nuclear apical membrane distance of a single intestinal cell. The mean distance is shown in red, and the error bars denote the 95% confidence interval

