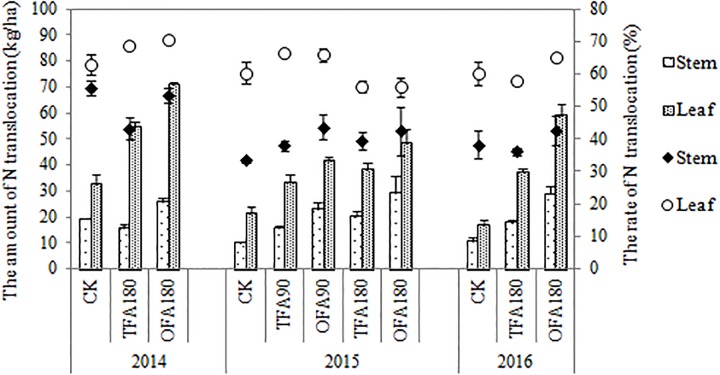
FIGURE 4.
Differences in the quantities and rates of nitrogen translocation. CK: no nitrogen applied; TFA: traditional nitrogen fertilizer application; OFA: optimized nitrogen fertilizer application; 90: total nitrogen application rate of 90 kg ha-1; 180: total nitrogen application rate of 180 kg ha-1. Data represent mean values of three biological replicates ± SE.

