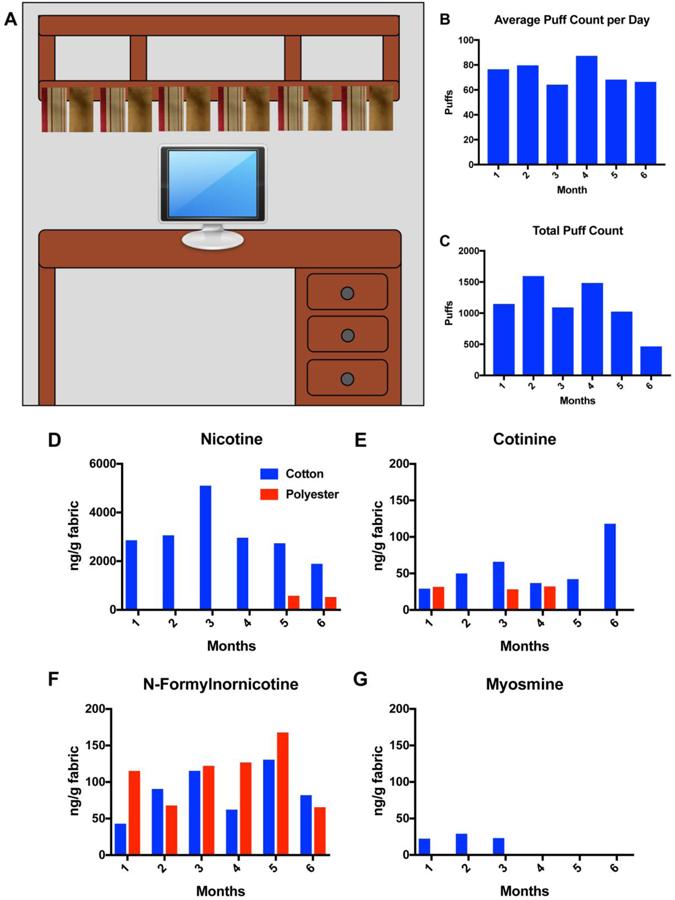
Fig 1: Living room field site.

(A) Schematic of six sets of cotton and polyester fabrics hung from a shelf on a desk where EC were used. (B) Average puff count/day for each month over 6 months. The average number of days that the user puffed was 15 days each month. (C) Total puff count for each month over 6 months. Concentrations of nicotine (D), cotinine (E), n-formylnornicotine (F), and myosmine (G) extracted from cotton and polyester fabrics hung inside the living room of an EC user. The scale for Figure D is 0–6000 ng/gram of fabric and the scale for Figure E-G is 0–200 ng/gram of fabric. Cotton – blue. Polyester – red.
