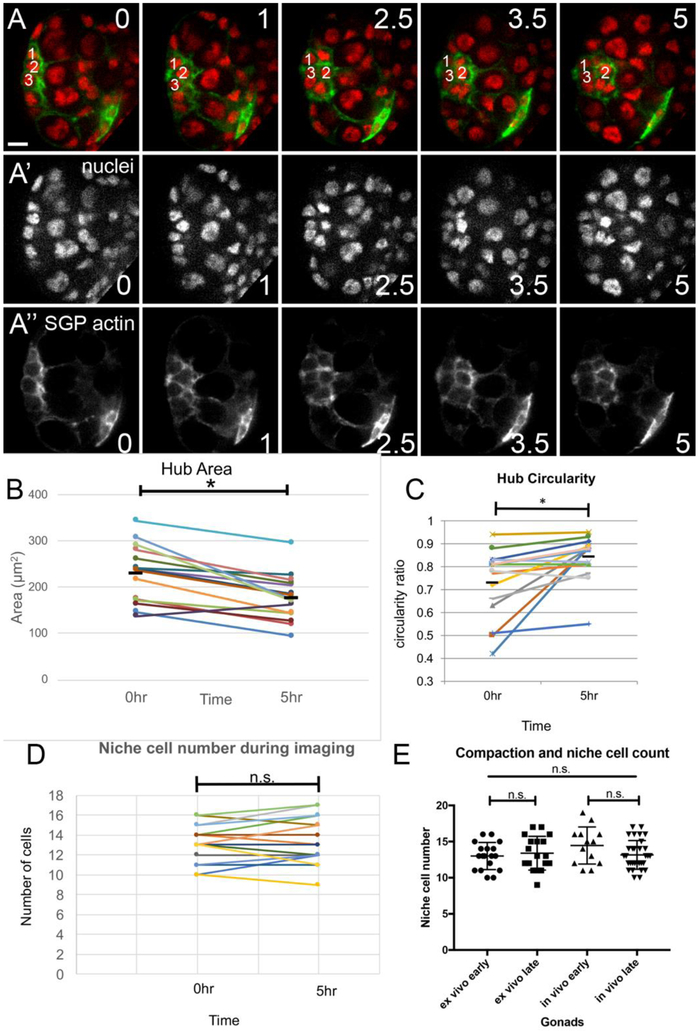
Figure 6: After compaction the hub occupies a smaller area and forms smoother boundaries facing the GSC tier.
A) ex vivo culture during compaction, showing all nuclei (HistoneRFP, red; single channel, A’), and F-actin in SGPs (six4-moesin-GFP; green, single channel, A”). The prospective hub is outlined, with three, cells labeled that were tracked. These cells exchanged neighbor relationships during compaction (t=0 through t=2.5hr). msSGPs, which exhibit higher F-actin, are labled (asterisk). Scale bar is 10 microns. B - D) Gonads were cultured ex vivo, and measured before Compaction (time =0) and after Compaction was completed (5hr), with connectors reporting values from the same gonad. B) Hub area showed a significant decrease (p < 0.05). C) The hub-GSC boundary became significantly smoother, reflected in increased circularity. Several niches exhibited fairly substantial changes. D) Niche cell number remained relatively constant during compaction, while area was decreasing and circularity was increasing. E) A direct comparison revealed no differences to niche cell number between ex vivo culture and in vivo development. Ex vivo early and late are the 0 and 5hr time points from (D). The in vivo samples are from gonads that were dissected and immediately fixed and stained, either early before compaction (~16h AEL), or late, after compaction was completed (~23h AEL).

