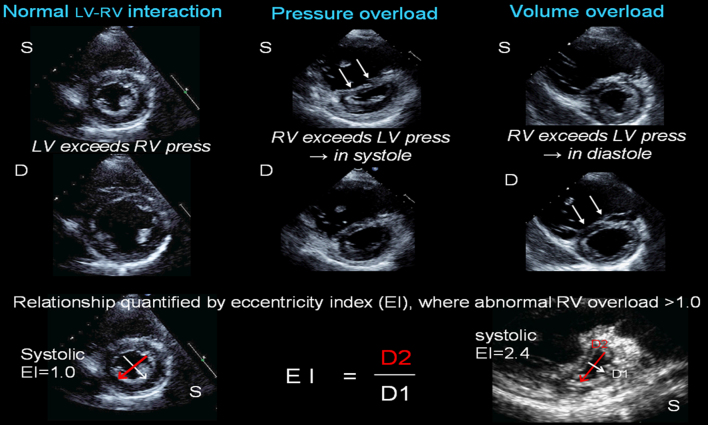
Figure 1.
Ventricular interaction. Left panel depicts normal ventricular morphology in systole (S) and diastole (D), where LV pressures exceed RV pressures throughout the cardiac cycle, and the ventricular septum (VS) assumes an outward curve towards the RV, such that the LV cavity is circular. Central panel shows RV pressure overload with significant VS flattening in systole. Right panel shows RV volume overload with significant VS flattening in diastole. Bottom panel shows how eccentricity index is measured, done in both systole and diastole and where EI >1.0, there is increasing volume (seen primarily in diastole) or pressure (seen primarily in systole) overload. Right example shows severe pressure overload with EI 2.4 in systole.

 This work is licensed under a