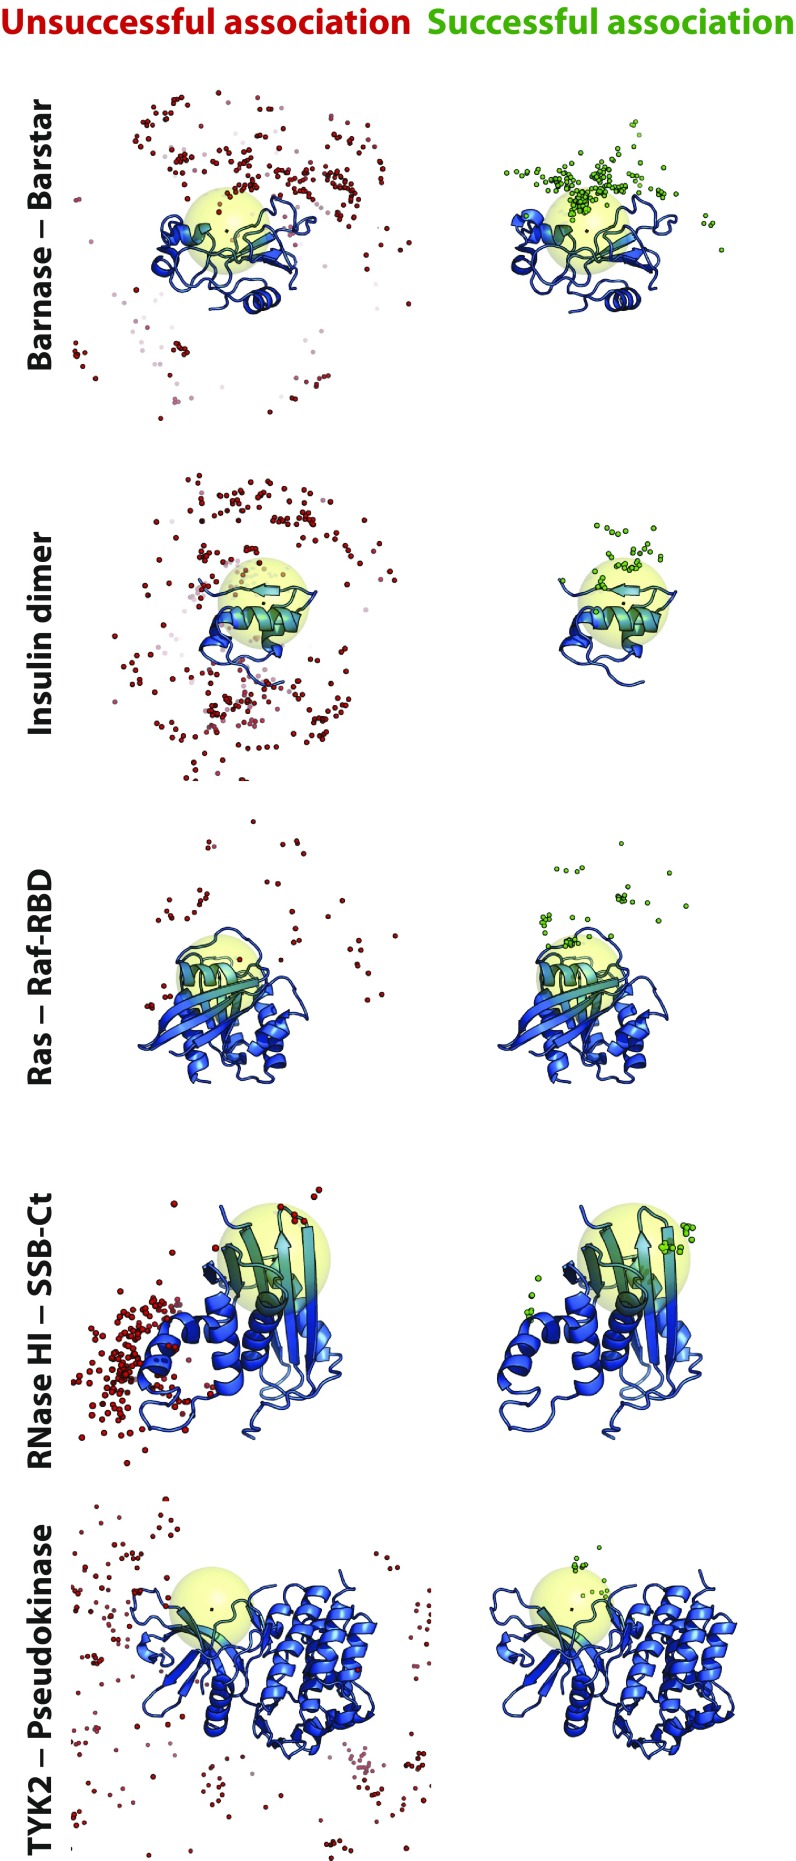
Fig. 3.
Encounter complexes visited in successful association events favored structures in which the two proteins were positioned similarly to how they are positioned in the experimentally determined complex. Simulation frames were uniformly sampled from encounter complexes and aligned to the larger protein. A single snapshot of the larger protein (blue cartoon) is shown for reference, overlaid with multiple snapshots of a Cα atom of the smaller protein near the center of the native binding interface taken from unsuccessful (red spheres) and successful (green spheres) association trajectories. The large yellow sphere indicates a region defined by a 10-Å radius around the center of mass of the binding interface of the larger protein. Kinetically trapped nonnative states, which neither dissociated nor reached the native state during a simulation, were not included in this analysis.

