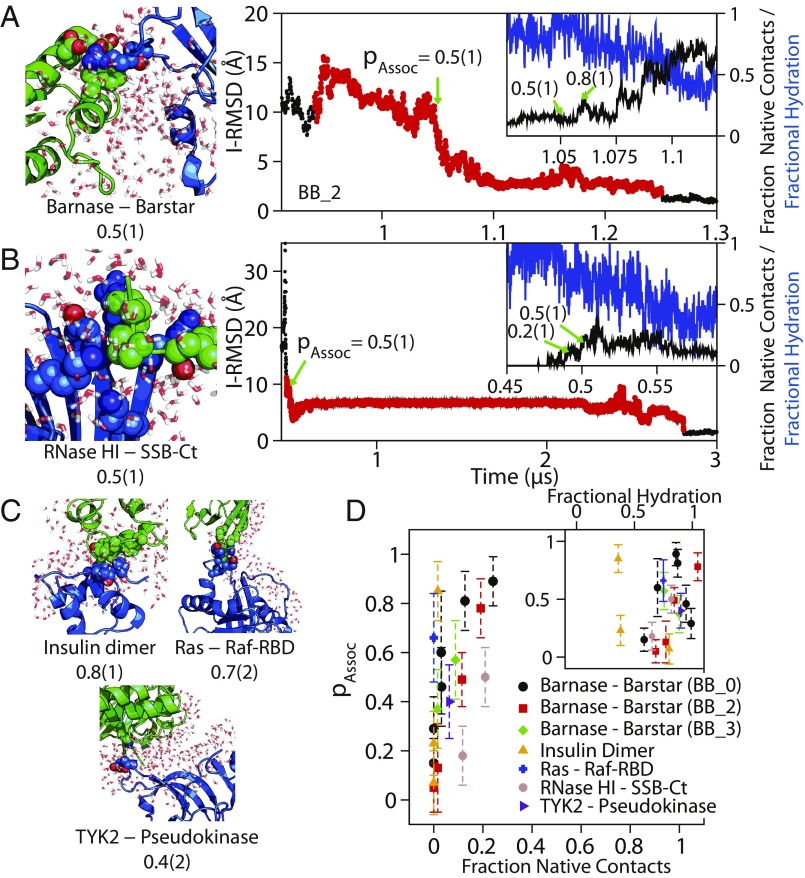
Fig. 4.
The transition state for association was solvated, and only <20% of native contacts had formed. Configurations and portions of I-RMSD traces from successful association events in conventional MD simulations of (A) barnase–barstar and (B) RNase HI–SSB-Ct association are shown. The green arrows indicate points where pAssoc was calculated in the successful association event (red circles). The Insets show an expanded view of the region close to the transition state, showing the fraction of native contacts (black) and fractional hydration around the interface (blue) as a function of time (SI Appendix). Additional configurations near the transition state of association are shown for (C) insulin dimer, Ras–Raf-RBD, and TYK2-pseudokinase. Configurations show the larger protein as a blue cartoon, the smaller protein as a green cartoon, interprotein residue contacts between residues at the native interface as van der Waals spheres, and water within 4 Å of the native binding interfaces as red and white licorice, demonstrating the lack of protein–protein contacts and the large amount of water at the binding interface. (D) A plot of the probability of association, pAssoc, against the fraction of native contacts and a normalized water interface coordinate (Inset). The fraction of native contacts remained below 30% even for configurations that had a committor probability of 90% to the native-complex state. Protein–protein interfaces in the successful association events, except for insulin dimer, which has a relatively hydrophobic interface, also remained more than 50% solvated. We note that these observations about the fraction of native contacts and interface solvation are qualitatively similar for the transition state of barnase–barstar determined under three different force field conditions: BB_0, BB_2, and BB_3 (SI Appendix, Fig. S7).

