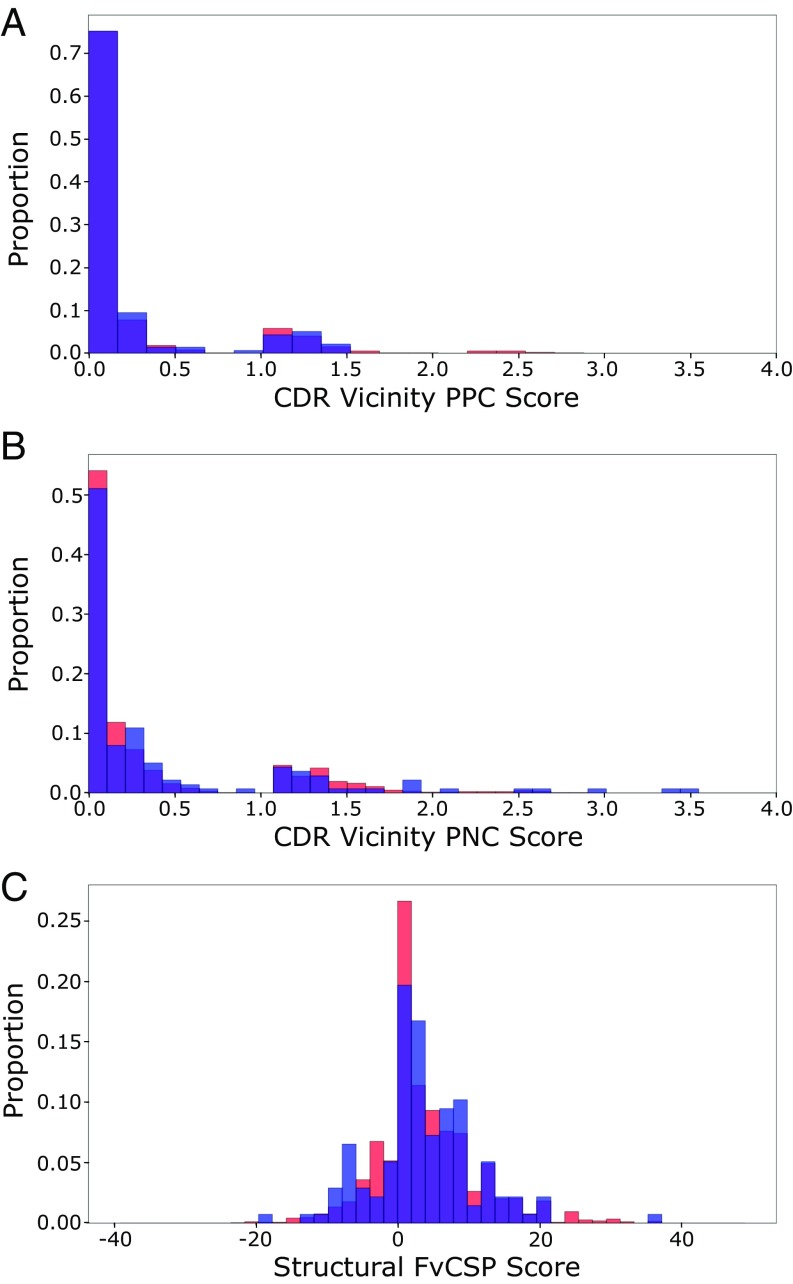
Fig. 3.
Histograms of 137 CST (blue) and human VdH Ig-seq model (red) values for the (A) PPC and (B) PNC metrics in the CDR vicinity. In both measures, the datasets are biased away from higher scores. (C) Histogram of structural Fv charge symmetry parameter values. Both datasets show a bias away from negative values.

