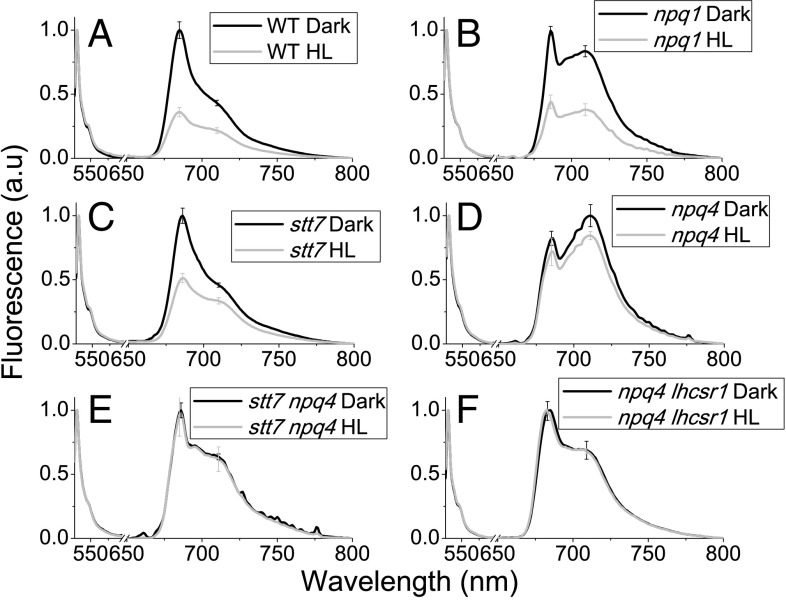
Fig. 2.
Here, 77 K fluorescence emission spectra of C. reinhardtii WT (A) and npq1 (B), stt7 (C), npq4 (D), stt7 npq4 (E), and npq4 lhcsr1 (F) mutant cells normalized to GFP before and after HL exposure. Fluorescence emission spectra of C. reinhardtii were recorded for whole cells that were dark adapted (black) or HL treated (1,500 μE m−2⋅s−1) for 6 min (gray). GFP was added as internal standard for normalization. SDs are reported as error bars (n = 4).

