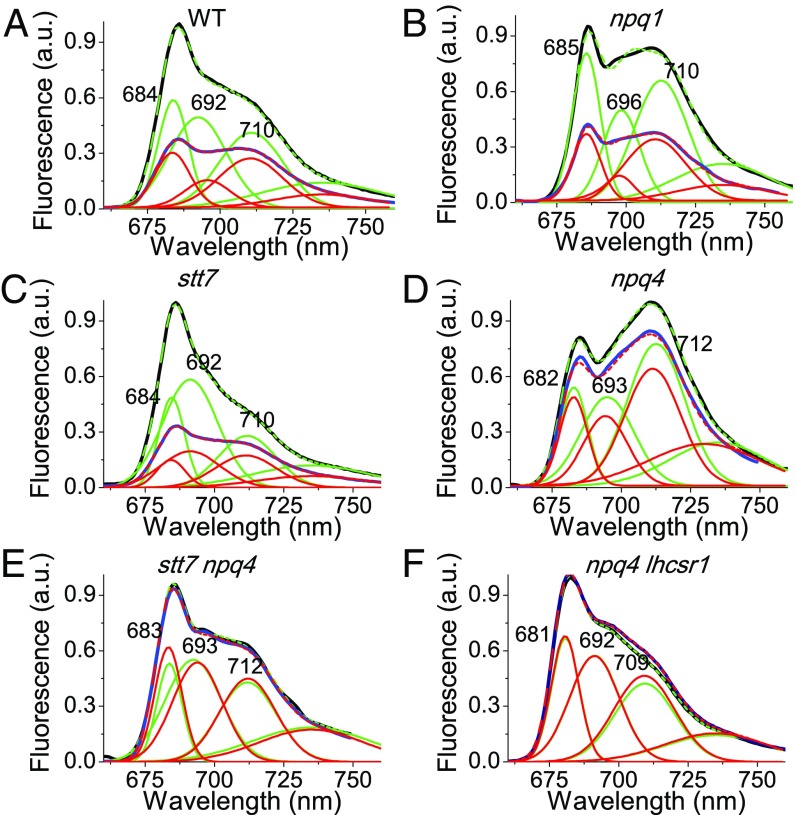
Fig. 3.
Fluorescence emission spectra of dark-adapted (black) or HL-treated (blue) WT (A) and npq1 (B), stt7 (C), npq4 (D), stt7 npq4 (E), and npq4 lhcsr1 (F) mutant cells were reconstructed by spectral deconvolution with Gaussians: cumulative fit results are reported in dashed green (dark-adapted samples) or dashed red (HL-treated samples), whereas the different Gaussians used are reported in green (dark-adapted samples) or red (HL-treated samples). GFP was added as internal standard for normalization.

