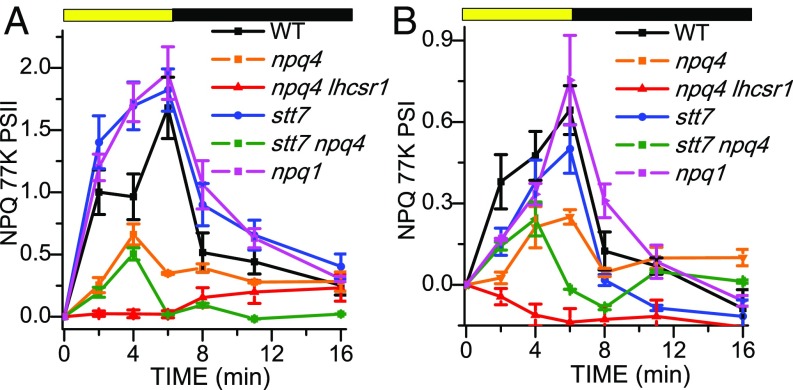
Fig. 4.
Calculated NPQ induction kinetics at 77 K. The NPQ curves were calculated for PSII (A) and PSI (B) from the area of the sum of the Gaussians used for the fitting according to the formula (ADark − AX)/AX, where AX and ADark are, respectively, the amplitude at time X (AX) or at time 0 (ADark, dark-adapted samples) of the different Gaussians attributable to PSII or PSI. SDs are reported as error bars (n = 4).

